Snowflake Reporting: How to Build Faster, Safer Dashboards
Snowflake can make a chart, but reliable reporting takes more than a connector. Use this practical guide to choose an architecture, secure access, control compute, and launch dashboards people trust.

Your data is centralized in Snowflake, but the answers people need are still scattered across SQL requests, stale exports, and dashboards nobody fully trusts. A useful Snowflake reporting setup closes that last mile: it gives business users timely answers while keeping metric logic, access, performance, and spend under control.
The hard part is not connecting a chart to a warehouse. It is choosing the right reporting architecture, preparing trustworthy data, and preventing every dashboard refresh from becoming a new security or cost problem. This guide walks through those decisions so you can build a workflow that works after the first demo.
What is Snowflake reporting?
Snowflake reporting is the process of querying data stored in Snowflake and presenting the results as recurring reports, dashboards, alerts, or interactive answers. Teams can report through Snowflake's native Snowsight interface, a connected business intelligence platform, or a purpose-built analytics application that sends queries to Snowflake.
That definition matters because Snowflake itself is primarily the data and compute layer. It stores governed data and executes analytical workloads; the reporting experience determines how people ask questions, interpret results, share insights, and take action.
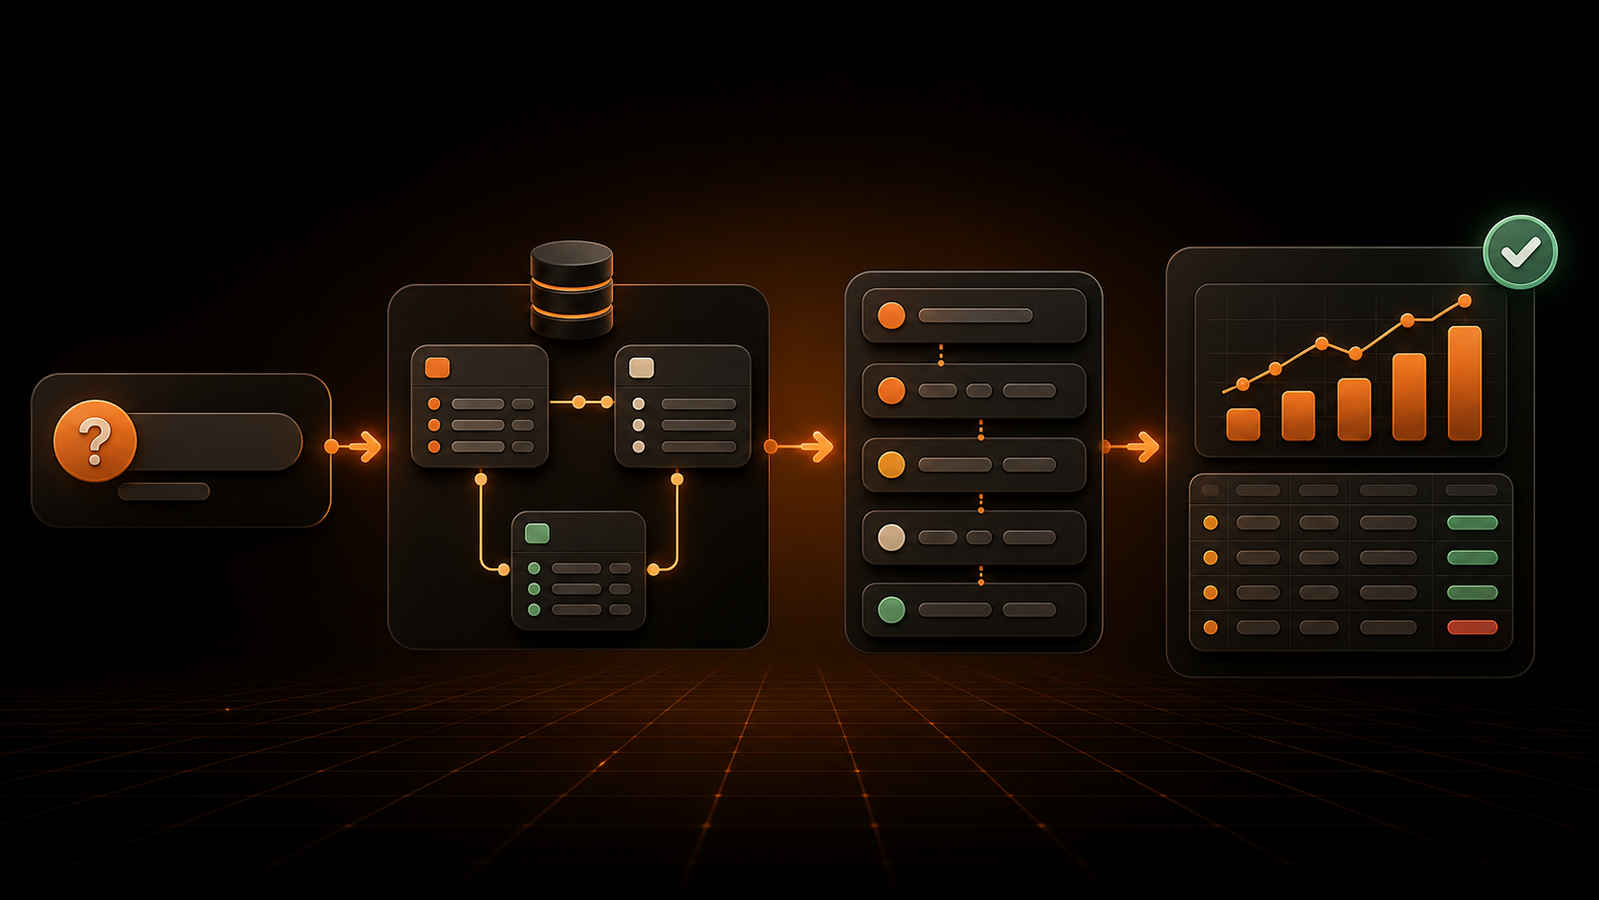
A complete reporting system therefore has four parts:
- Trusted data models: cleaned tables or views with agreed definitions for revenue, active customers, fulfillment time, and other business metrics.
- Controlled query access: roles, policies, and credentials that limit each user or application to the data it needs.
- A consumption layer: dashboards, scheduled reports, embedded analytics, or conversational analysis.
- Operational controls: monitoring for freshness, query failures, performance, adoption, and compute cost.
If one layer is missing, the interface may look polished while the system remains unreliable.
Is Snowflake a reporting tool or a data platform?
Snowflake is a data platform with native reporting capabilities, not a full substitute for every business intelligence use case. Its web interface, Snowsight, can run SQL, create charts, arrange dashboard tiles, apply filters, and share dashboards with other Snowflake users. Snowflake's Snowsight overview also covers notebooks, Streamlit apps, cost management, query history, and governance administration.
Native dashboards are often enough for data teams, operational monitoring, proofs of concept, and focused internal use cases. They keep SQL and visualization close to the warehouse, reduce the number of systems to manage, and make it easy to inspect the query behind a chart.
However, broader business reporting may require capabilities such as a reusable semantic layer, governed self-service exploration, pixel-perfect scheduled documents, mobile delivery, sophisticated visualization, embedded customer analytics, or a highly approachable interface for people who do not write SQL. Those needs usually point to an external BI or analytics layer.
There is also a timely migration consideration. Snowflake states that Legacy Dashboards were removed on June 22, 2026 and documents migration paths on its current Snowsight dashboard page. If your team still has old dashboard definitions or operating instructions, verify that they refer to the current experience before building on them.
The right question is not “Can Snowflake make a chart?” It can. Ask instead: “Which reporting experience gives our users the right balance of flexibility, governance, speed, and operating effort?”
Three Snowflake reporting architectures
Most implementations fall into one of three patterns. You can use more than one, but each should have a defined audience and purpose.
1. Native reporting in Snowsight
In this pattern, analysts write SQL in Snowflake and turn query results into charts and dashboard tiles. It has the shortest path from a governed view to a visualization and avoids another vendor connection.
Choose it when:
- the audience already has Snowflake access;
- SQL proficiency is common;
- the use case is internal and relatively focused;
- keeping administration inside Snowflake is valuable; or
- you need operational dashboards for data, query, or cost monitoring.
Be aware of the sharing model. Snowflake explains that a viewer must use the same role as the session context for the queries that drive a shared dashboard, and dashboard queries run with the viewer's primary role. Review those dashboard sharing and role requirements early; a dashboard that works for its creator can fail for a colleague with a different role or warehouse grant.
2. A connected BI platform
Power BI, Tableau, Looker, Sigma, Metabase, and similar platforms provide richer consumption experiences over Snowflake. They may add semantic modeling, drag-and-drop exploration, alerts, subscriptions, collaboration, embedding, or enterprise content management. If Microsoft BI is your current baseline, use this Power BI alternatives comparison to frame the tradeoffs before shortlisting.
Choose this pattern when:
- many non-SQL users need repeatable dashboards;
- metric definitions must be reused across many reports;
- teams need advanced visualization or formatted distribution;
- analytics must appear inside a customer-facing product; or
- the organization already operates a BI standard.
The connection mode matters. A live or direct-query model keeps queries in Snowflake and can show fresher data, but every interaction can consume warehouse resources. An import or extract model can make report interactions faster and more predictable, but it introduces a second copy, a refresh schedule, and potential freshness or governance gaps. Test both with realistic data volume and concurrency rather than choosing from a feature checklist.
3. Conversational or application-led analytics
This pattern lets a user ask a business question, generates or selects a query, and returns a table, chart, or saved dashboard. It fits ad hoc questions that are too variable for a fixed dashboard but too frequent to route through an analyst queue.
Choose it when:
- founders and operators need follow-up answers, not just fixed KPIs;
- SQL requests are creating a data-team bottleneck;
- users can express the question but not the query;
- the application can enforce a safe access boundary; and
- generated results remain inspectable and auditable.
Natural-language access does not remove the need for modeled data. It makes clear naming, documented metrics, access policies, and query guardrails more important because ambiguity can now produce an executable query in seconds.
| Architecture | Best for | Main advantage | Main tradeoff |
|---|---|---|---|
| Snowsight dashboards | Data teams and focused internal reporting | Minimal platform sprawl | SQL-oriented user experience and Snowflake-specific sharing rules |
| Connected BI platform | Governed reporting across many users | Rich modeling, visualization, and distribution | Additional administration, licensing, and connection design |
| Conversational analytics | Fast ad hoc answers for mixed-skill teams | Reduces dependence on manual SQL requests | Requires strong semantic context and query safeguards |
How to choose a Snowflake reporting tool
Start with the decision you need to improve, then assess tools against the operating constraints around that decision. A long feature list can hide the difference between a reporting tool that demos well and one your team can govern.
Match the interface to the user
An analyst may want SQL visibility, reusable models, version control, and query diagnostics. A finance leader may want certified metrics, scheduled tables, comments, and exportable records. An operations manager may need filters, alerts, and quick follow-up questions.
Write down the primary user, their skill level, the questions they ask repeatedly, and the action that follows an answer. If one tool must serve several groups, test each workflow separately.
Decide where metric logic lives
Metrics defined independently inside individual charts drift. “Active customer” becomes one filter in finance, another in product, and a third in an executive spreadsheet.
Prefer a design where important business logic lives in governed Snowflake views, a transformation layer, or a reusable semantic model. The reporting tool should consume those definitions consistently. Document the owner, grain, dimensions, exclusions, timezone, and refresh expectation for every critical metric.
Inspect connection and authentication options
Verify whether the platform supports a native Snowflake connector, the required network path, and an authentication method appropriate for humans or services. Snowflake's authentication overview describes OAuth, key-pair authentication, workload identity federation, and other supported approaches.
Avoid designing a long-lived production integration around a shared person's credentials. Use a dedicated identity, least-privilege role, credential rotation process, and named owner. Confirm how the tool maps viewer identity to Snowflake roles, especially if different users must see different rows.
Model total cost, not just license price
The reporting bill includes more than seats. Account for Snowflake compute during refreshes and interactive queries, administration, semantic modeling, training, embedded-viewer charges, and the time spent troubleshooting failed or slow reports.
Direct query can shift more cost into Snowflake; extracts can shift cost and complexity into refresh infrastructure and duplicated storage. Snowflake provides cost dashboards plus granular ACCOUNT_USAGE and ORGANIZATION_USAGE views for custom analysis, as described in its compute cost guide. Use actual workload measurements from a pilot rather than relying on a pricing calculator alone.
Test governance and distribution
Ask how the tool handles roles, row-level filtering, sensitive columns, audit logs, public links, exports, and embedded access. A dashboard permission does not automatically correct an overprivileged database role.
Also evaluate how insights reach people. Some teams need an interactive workspace; others need a morning email, a Slack alert, a PDF for a controlled process, or an embedded panel inside an internal application. Distribution is part of the reporting architecture, not a finishing touch.

Snowflake reporting setup: a seven-step workflow
Use this sequence to move from an attractive prototype to a dependable reporting service.
1. Define the decision and service level
Name the audience, decision, and expected response. “Sales dashboard” is vague; “regional managers review pipeline coverage every Monday and reassign accounts below 3× quota coverage” is testable.
Set a freshness target that matches the decision. A board metric may be daily or monthly, while an inventory exception may need updates every few minutes. Faster is not automatically better if it creates needless refresh cost.
2. Establish trusted reporting models
Do not point every report directly at raw ingestion tables. Create analysis-ready views or tables with stable names, declared grain, sensible data types, consistent timezones, and tested joins. A bronze, silver, and gold data-layer design is one practical way to separate raw inputs from validated and consumption-ready models.
For each important metric, record:
- its business definition and owner;
- source tables and transformation logic;
- reporting grain and allowed dimensions;
- inclusion and exclusion rules;
- expected update cadence; and
- tests for nulls, duplicates, and reconciliation.
This is the layer that prevents two correct-looking dashboards from telling different stories.
3. Create a reporting access boundary
Provision a dedicated reporting role with only the database, schema, warehouse, view, and function privileges it needs. Expose curated views instead of entire raw schemas where practical. Separate content creators from viewers if their privileges differ.
For data that varies by user, region, tenant, or department, evaluate row access policies and masking policies at the data layer. Snowflake explains that row access policies determine which rows a query returns and can use role or mapping-table context. Check edition requirements and test the policy through the exact identity path your reporting tool uses.
4. Isolate and configure the reporting workload
Give BI workloads a named virtual warehouse instead of letting them compete blindly with transformation jobs. This makes performance and spend easier to attribute and gives you independent control over sizing, auto-suspend behavior, and concurrency.
Start small, observe, then tune. A larger warehouse may accelerate compute-heavy queries, but it will not repair inefficient joins, unnecessary scans, or a poor data model. For high concurrency, evaluate workload patterns and Snowflake warehouse options rather than assuming vertical resizing is the only answer.
5. Connect the reporting experience safely
Configure the chosen tool with its dedicated identity and role, then test access with a non-admin account. Validate that it can query only intended objects, cannot perform writes, and fails closed when permissions are missing.
If the recurring pain is that non-technical stakeholders cannot answer follow-up questions, GetInsights offers a direct Snowflake connection that turns plain-English questions into SQL, charts, and shareable dashboards. Its separate read-only enforcement layer blocks write commands, making it worth evaluating for lean teams that want conversational self-service without a new ETL pipeline.
Regardless of platform, inspect generated SQL and query tags during the pilot. You need a reliable way to attribute queries, diagnose failures, and distinguish interactive use from scheduled refreshes.
6. Build a minimum viable reporting suite
Begin with one decision area and a small set of trusted outputs. A useful first release might contain:
- a top-level KPI with its definition and last-updated time;
- a trend that reveals direction rather than a single snapshot;
- a breakdown that helps locate the cause of movement;
- a filter aligned to how the audience owns the outcome; and
- a detail table or drill path for verification.
Avoid filling the first dashboard with every available metric. Each visual should answer a distinct question, use a suitable chart, and provide enough context to interpret changes.
7. Validate, launch, and monitor
Before launch, reconcile totals against an accepted source, test boundary dates and empty states, verify permissions as each user type, and run concurrent refreshes. Record baseline load time and compute consumption.
After launch, monitor data freshness, query errors, slow tiles, refresh duration, warehouse credits, report views, and repeated ad hoc requests. Low usage may indicate poor discoverability, low trust, or a mismatch between the report and the decision—not merely a training problem.
Snowflake reporting performance and cost controls
Reporting workloads are repetitive, interactive, and bursty. That combination rewards deliberate design.
Reduce work before adding compute
Keep filters selective, avoid returning unused columns, and aggregate at the grain the visualization actually needs. Move stable, expensive business logic into governed models instead of recalculating it independently in every chart.
Snowflake's performance optimization guide recommends examining historical execution, query performance, warehouse configuration, and storage strategies. It also points to Performance Explorer for interactive workload analysis. Use query history to identify long-running or frequently repeated reporting queries before changing warehouse size.
Separate freshness from interactivity
A report can use fresh data without recomputing every transformation on every click. Decide which layers update continuously, on a schedule, or on demand. Pre-aggregate high-traffic metrics when the raw query is expensive and the decision does not require row-level immediacy.
For extract-based tools, stagger refreshes to avoid a synchronized compute spike. For direct-query tools, test filters, drill-downs, and concurrent viewers—not just the initial page load.
Attribute spend to the workload
Use a dedicated warehouse, consistent query tags, and reporting identities so usage can be separated from ingestion or transformation. Snowflake's cost documentation identifies views such as WAREHOUSE_METERING_HISTORY for hourly warehouse consumption and QUERY_ATTRIBUTION_HISTORY for per-query warehouse usage.
Track cost beside a useful denominator: active report users, successful refreshes, decisions served, or a business outcome. A low-cost dashboard nobody trusts is not efficient; a high-value workflow may justify more compute.
Design for safe caching and reuse
Reuse certified datasets and semantic definitions across reports. Avoid small variations of the same expensive query when a governed model can serve all of them. If a tool adds its own cache or extract, document the refresh behavior and show users when the data was last updated.
Common Snowflake reporting mistakes
Treating raw data as report-ready
Raw schemas often preserve source-system complexity, inconsistent identifiers, late-arriving records, and technical names. Connecting them directly to a self-service tool transfers modeling work to every report author and creates inconsistent answers.
Granting broad access to make a demo work
Admin credentials and blanket schema access remove friction during setup, then become production risk. Build the least-privilege role before the pilot and test it with representative users.
Optimizing only the dashboard design
A clean layout cannot compensate for slow joins, undefined metrics, or stale data. Treat the visual, semantic, query, and warehouse layers as one service.
Choosing direct query or extracts by habit
Neither mode is universally superior. Evaluate freshness, concurrency, data volume, governance, latency, and total operating cost for the actual workload.
Launching without ownership
Every production report needs a business owner and a technical owner. Define who approves metric changes, responds to failures, reviews access, and retires unused content.
Measuring views instead of outcomes
Dashboard opens are a useful signal, but they do not prove better decisions. Pair adoption with a workflow measure such as fewer manual report requests, shorter time to answer, faster exception handling, or fewer reconciliation disputes.
A practical evaluation scorecard
Score each candidate from 1 to 5 using evidence from a proof of concept. Weight the criteria before testing so a polished demo does not silently change your priorities.
| Criterion | Evidence to collect | Suggested weight |
|---|---|---|
| User fit | Target users complete three real tasks without coaching | 20% |
| Metric governance | Reusable definitions produce consistent results across reports | 15% |
| Security | Least-privilege role, identity mapping, row filtering, and audit trail work as designed | 20% |
| Performance | Median and slowest response under representative concurrency | 15% |
| Cost | License, Snowflake compute, administration, and implementation estimate | 15% |
| Distribution | Scheduling, alerts, exports, sharing, or embedding match the workflow | 10% |
| Operability | Failures, freshness, usage, and ownership are observable | 5% |
Use the same Snowflake models, user tasks, data volume, and concurrency for every candidate. Record defects and setup effort as well as successful features. The winner should be the option with the best operating fit, not necessarily the most capabilities.
Frequently asked questions
Is Snowflake a reporting tool?
Snowflake is primarily a cloud data platform, but it includes native charts and dashboards in Snowsight. Many teams connect a dedicated BI or analytics tool when they need broader self-service, semantic modeling, distribution, embedding, or advanced visualization.
Does Snowflake have built-in reporting?
Yes. Snowsight can visualize query results as charts, organize charts into dashboards, add filters, and share dashboards with other Snowflake users. Review current role and warehouse requirements before relying on native dashboard sharing.
Which reporting tools work with Snowflake?
Snowflake works with native Snowsight dashboards and many external platforms, including Power BI, Tableau, Looker, Sigma, Metabase, and conversational analytics tools. Choose based on user workflow, governance, connection mode, security, performance, and total cost rather than popularity alone.
Should Snowflake dashboards use live queries or extracts?
Use live queries when freshness and centralized Snowflake governance matter most and the warehouse can support interactive concurrency. Use extracts when predictable interaction speed or offline processing matters more, while accounting for duplicated data, refresh lag, and another governance boundary.
How do you improve Snowflake dashboard performance?
Start by measuring query history, then reduce unnecessary scans, model reusable aggregations, apply selective filters, and isolate reporting on an appropriately configured warehouse. Test concurrent users and refresh schedules before resizing compute.
Is it safe to connect a reporting tool directly to Snowflake?
It can be safe when the integration uses a dedicated identity, an approved authentication method, a least-privilege role, governed views, and appropriate row or masking policies. Validate permissions with a non-admin user and retain query attribution and audit records.
How do you control Snowflake reporting costs?
Separate reporting onto a named warehouse, use query tags and dedicated identities, stagger refreshes, suspend idle compute, and inspect warehouse and query attribution history. Compare cost with adoption and business value rather than optimizing credits in isolation.
Build the reporting system your decisions require
Good Snowflake reporting is not a tool connection; it is a managed path from trusted data to a decision. Choose Snowsight for focused native workflows, a connected BI platform for broad governed consumption, or conversational analytics for fast follow-up questions—then support the choice with modeled data, least-privilege access, workload isolation, and measurable ownership.
Before buying or expanding a platform, run one representative workflow through the scorecard above. If your bottleneck is ad hoc questions from non-technical teams, start with a controlled Snowflake proof of concept and measure time to answer, query safety, dashboard performance, and compute cost together.
Ask your data a question instead
Connect your database and ask in plain English. GetInsights writes the SQL, runs it read-only, and hands you the chart and dashboard.
Start for free