Architecture of Data Warehousing: Layers, Tiers, and Design
When reports disagree, dashboards lag, or every new metric needs another fragile pipeline, the problem is often deeper than the BI tool. The architecture of data warehousing determines how data moves, where it is cleaned, who can trust it, and how quickly it becomes useful.
When reports disagree, dashboards lag, or every new metric needs another fragile pipeline, the problem is often deeper than the BI tool. The architecture of data warehousing determines how data moves, where it is cleaned, who can trust it, and how quickly it becomes useful.
Data warehouse architecture is the blueprint for moving data from operational sources into an analytics-ready system and then serving it to people and applications. It defines the ingestion, transformation, storage, modeling, governance, and consumption layers—and the boundaries between them.
The familiar one-tier, two-tier, and three-tier diagrams are useful, but they are only part of the picture. A practical design must also answer questions about data freshness, workload isolation, ownership, cost, security, and the business decisions the warehouse exists to support.
What the architecture of data warehousing actually describes
A data warehouse stores current and historical data from multiple systems in a structure designed for analysis rather than day-to-day transactions. Its architecture describes the components and processes that make that possible. Databricks frames it as the organizing and implementation framework, including the warehouse’s components, processes, and structure.
Two views are commonly mixed together:
- Logical layers describe responsibilities in the data flow: source, ingest, transform, model, serve, and govern.
- Physical tiers describe how those responsibilities are deployed: in one combined system, across a client and warehouse, or across separate storage, analytical processing, and presentation tiers.
This distinction matters. A cloud platform may separate storage and compute physically while still exposing a single managed service. Conversely, one database cluster may contain several logical layers through schemas, roles, and workloads.
A useful high-level flow is:
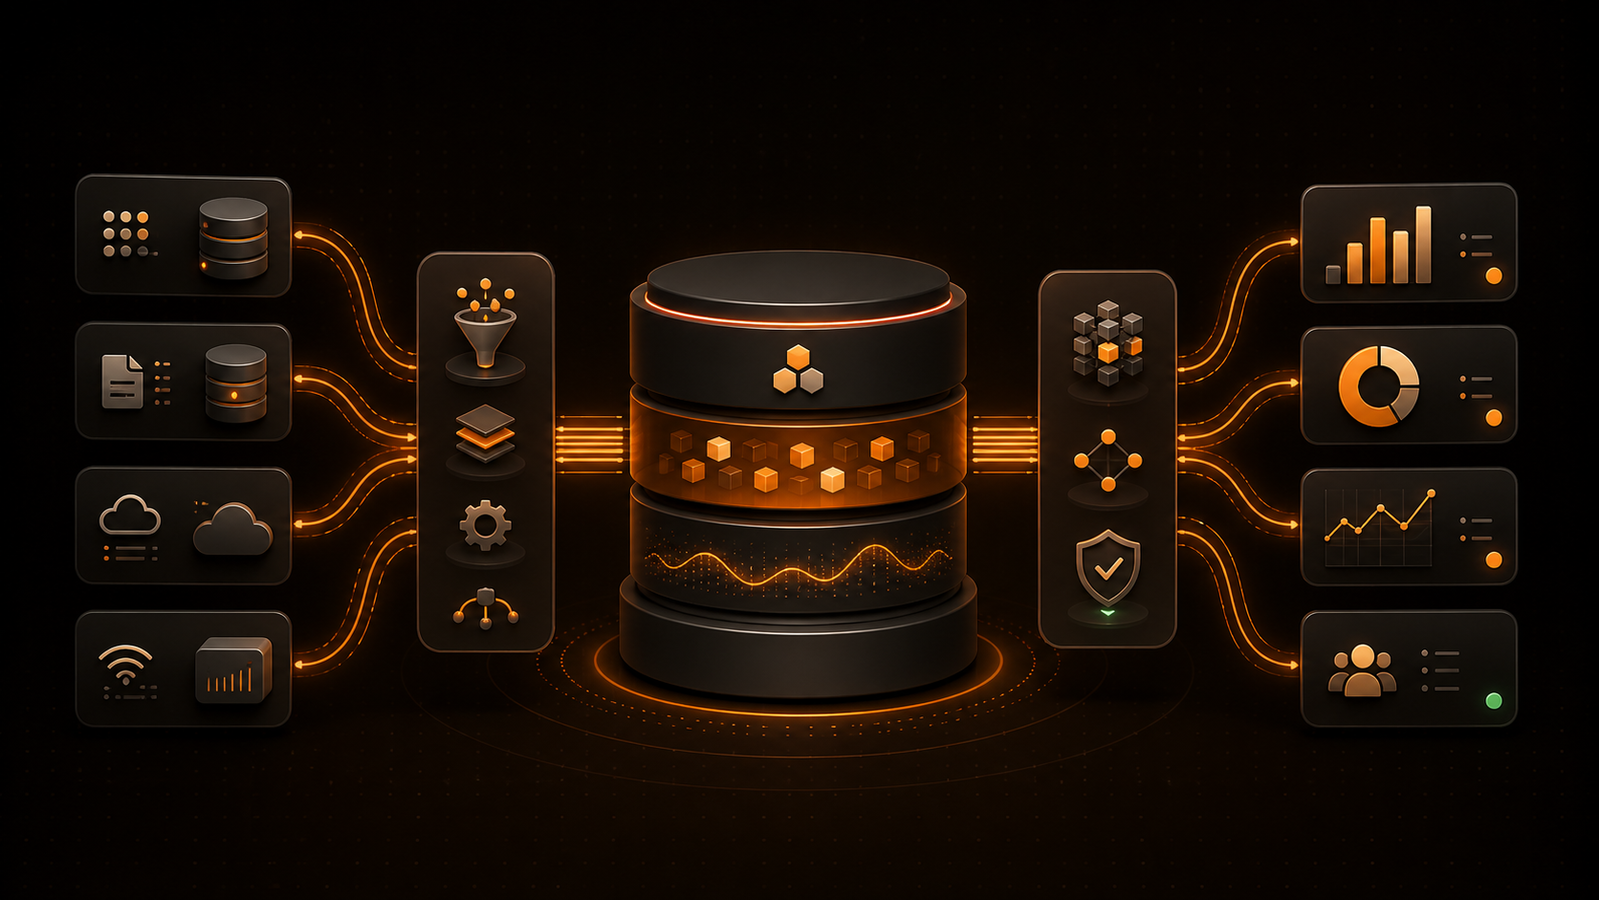
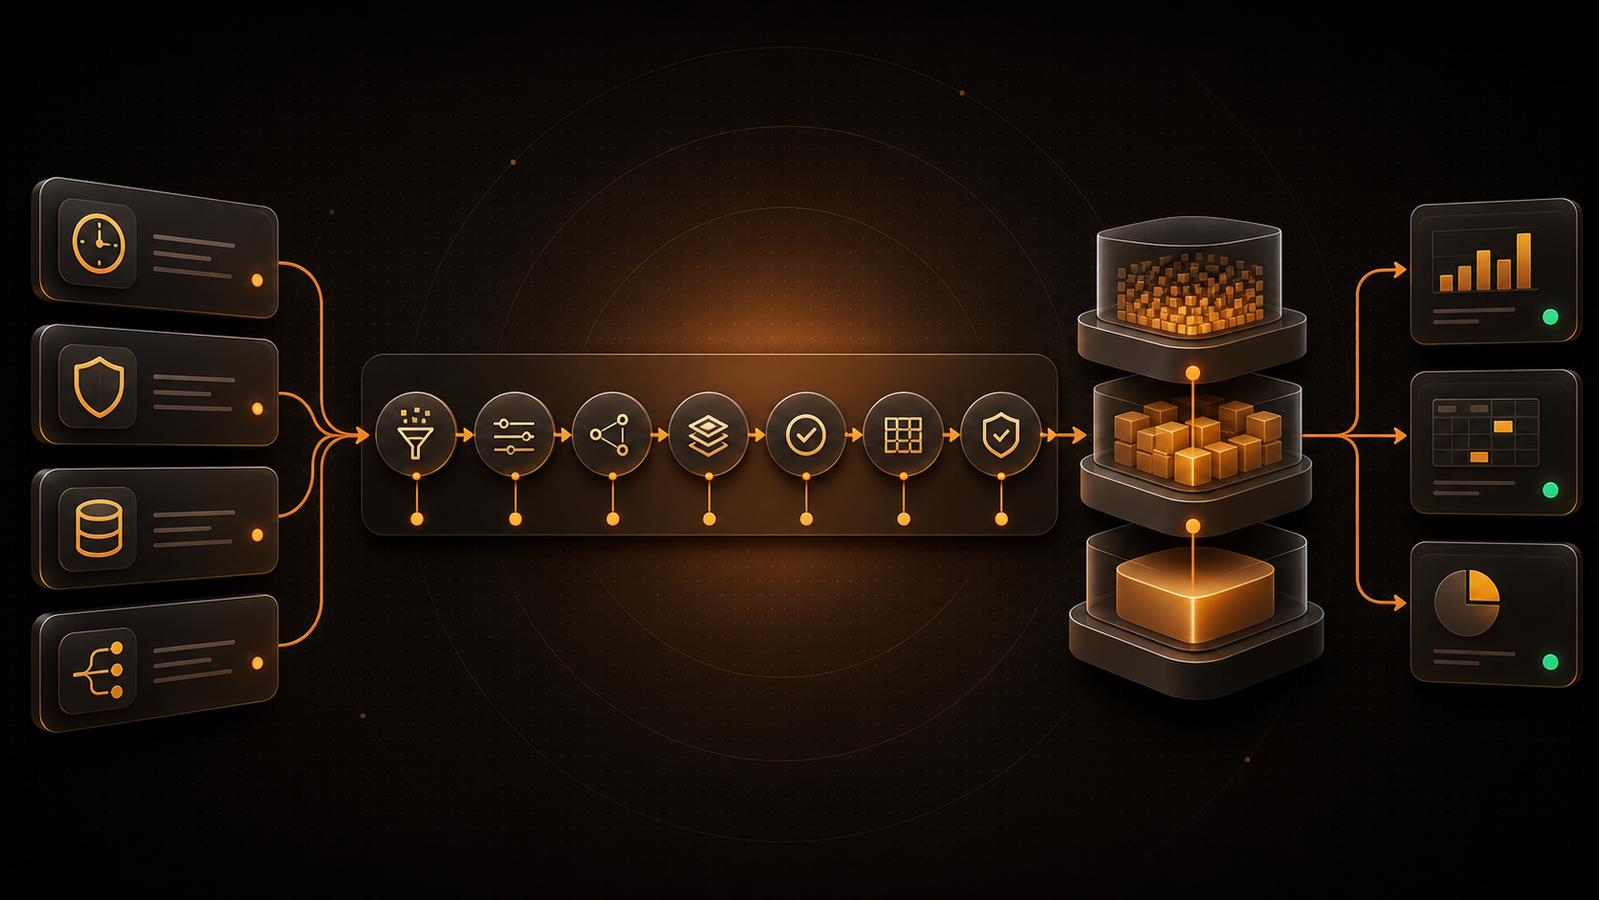
Sources → Ingestion → Staging/raw data → Transformation → Curated warehouse models → Semantic/serving layer → BI and applications
Governance, metadata, security, quality checks, orchestration, and observability span the entire flow. They are not a final box added after the pipeline works.
Core layers in the architecture of data warehousing
Modern implementations use different products and names, but most designs contain the following responsibilities.
1. Source layer
Sources are the systems that create business data: transactional databases, ERP and CRM platforms, payment processors, product applications, spreadsheets, event streams, and third-party APIs.
Inventory each source by owner, data shape, update frequency, retention policy, and operational sensitivity. Pulling large analytical queries directly from a production database can compete with customer-facing transactions, so the architecture needs a safe extraction method and a clear freshness target.
2. Ingestion layer
The ingestion layer moves data into the analytical environment. Common patterns include:
- scheduled batch loads for daily or hourly reporting;
- change data capture (CDC) for incremental database changes;
- streaming for events that must arrive in seconds or minutes;
- file and API ingestion for external or irregular datasets.
Choose the simplest pattern that meets the decision deadline. A dashboard used in a weekly planning meeting does not benefit from a streaming pipeline merely because streaming is available.
In ETL, data is transformed before it is loaded into the warehouse. In ELT, raw or lightly processed data is loaded first and transformed using warehouse compute. IBM’s ETL definition emphasizes combining, cleaning, and organizing data from multiple sources; ELT changes where that work runs, not the need for it.
3. Staging and raw-storage layer
A staging area provides a controlled landing zone between sources and curated models. It helps teams preserve source fidelity, retry failed loads, reconcile counts, and investigate quality issues without repeatedly querying production systems.
Raw data should be immutable or reproducible where practical. Microsoft’s modern data warehouse guidance recommends pipelines that are replayable and idempotent, meaning the same input can be processed again without silently duplicating or corrupting results. That property turns recovery from an emergency into an expected operating procedure. Microsoft also separates modern warehouse flow into ingest, transform, model, and serve stages.
4. Transformation and quality layer
This layer standardizes types, resolves identifiers, applies business rules, handles late-arriving data, and tests whether output is complete and valid. It is where “customer,” “net revenue,” or “active subscription” becomes a governed definition rather than an analyst’s private calculation.
Useful controls include schema-change detection, uniqueness and referential-integrity tests, freshness alerts, source-to-target reconciliation, and quarantine paths for bad records. A successful job is not necessarily a trustworthy job; orchestration status and data quality are separate signals.
5. Warehouse and modeling layer
The warehouse stores curated historical data in models optimized for analytical access. Dimensional designs commonly organize numerical events in fact tables and descriptive context in dimension tables. Star schemas favor simpler joins and business readability, while normalized approaches can reduce redundancy and support enterprise integration.
The choice is not purely technical. Start with the questions users need to answer, define the grain of each fact, and make dimensions conform across domains. The conceptual data model guide explains the business-level work that should happen before tables and columns lock the design in place.
6. Semantic and serving layer
The serving layer presents curated data in a form that downstream consumers can use. It may include data marts, aggregate tables, a semantic model, APIs, governed views, metrics definitions, and workload-specific endpoints. Microsoft’s guidance notes that the same curated dataset may need multiple serving mechanisms depending on its consumers.
This is also where concurrency becomes visible. A finance close, executive dashboard refresh, ad hoc analyst query, and machine learning job may all hit the same data differently. Separate queues, warehouses, replicas, or compute pools can prevent one workload from degrading another.
7. Consumption layer
BI tools, notebooks, embedded analytics, reverse-ETL destinations, data applications, and AI assistants consume the serving layer. Access should follow role and purpose, with row- or column-level controls where sensitive data requires them.
The best consumption layer reduces the distance between a business question and a governed answer. It does not bypass modeling and access controls in the name of self-service.
Cross-cutting governance and operations
Every layer needs ownership, lineage, metadata, access policies, encryption, audit logs, cost monitoring, and service-level objectives. Google Cloud’s secured warehouse blueprint, for example, treats data classification, separation of duties, logging, masking, and column-level controls as architectural concerns rather than UI settings added later. The blueprint maps these controls across ingestion and storage.
How three-tier architecture of data warehousing works
The classic three-tier model groups a warehouse into bottom, middle, and top tiers:
| Tier | Primary responsibility | Typical components |
|---|---|---|
| Bottom | Acquire, prepare, and store data | Sources, staging, ETL/ELT, warehouse database |
| Middle | Process analytical queries | OLAP engine, query optimizer, aggregations, semantic logic |
| Top | Present data to users | Reports, dashboards, notebooks, analytics applications |
This model separates storage, analytical processing, and user access. That separation improves scalability and makes it easier to tune each responsibility independently. The current Google results’ three-tier reference uses the same bottom/middle/top split, while Databricks maps the top tier to BI, dashboarding, reporting, and analysis.
Single-tier architecture
A single-tier design combines storage, processing, and access as much as possible. It can suit a small proof of concept, a single team, limited sources, and simple reporting. Its weakness is coupling: transformation jobs, user queries, and operational responsibilities compete inside one system.
Two-tier architecture
A two-tier design usually connects client tools directly to a warehouse server, or separates staging from warehouse storage. It adds a clearer boundary than a single-tier system but can become difficult to govern when many desktop tools, extracts, or direct connections multiply.
Three-tier architecture
A three-tier design inserts an analytical or semantic tier between storage and presentation. It is a common conceptual fit for organizations that need shared business logic, higher concurrency, and several consumption tools.
Do not choose a tier count as if it were a product SKU. Start with the boundaries you need—for security, performance, deployment, and ownership—and document which component owns each responsibility.
Traditional and modern data warehouse patterns
Traditional warehouses often ran on tightly coupled on-premises appliances. Capacity planning, storage, and compute scaled together, and nightly batch processing was the default. Those systems can still be appropriate for stable workloads, strict locality requirements, or existing investments.
Cloud warehouses changed the deployment model more than the fundamental responsibilities. A leading pattern is the separation of storage and compute. Google’s BigQuery documentation describes independent storage and compute layers, allowing each to allocate resources without forcing analytical and management workloads into the same pool.
Other modern patterns include:
- Elastic or serverless compute: capacity expands for demand and contracts when idle.
- Multiple compute pools: ingestion, dashboards, data science, and ad hoc analysis can be isolated.
- Lake plus warehouse: inexpensive object storage holds raw or varied data, while curated warehouse tables serve governed SQL analytics.
- Lakehouse: open file formats and table-management features support warehouse-style reliability alongside data science and machine learning workloads.
- Batch plus streaming: stable dimensions and large backfills may remain batch-based while operational events arrive continuously.
Modern does not mean assembling every pattern. Each additional engine, copy, and interface creates another failure boundary and governance surface. The better architecture is the smallest one that meets freshness, scale, recovery, and access requirements with room to evolve.
How to design a data warehouse architecture in seven decisions
The architecture should emerge from business constraints, not from a cloud diagram. Work through these decisions in order.
1. Define decisions and service levels
List the recurring decisions the warehouse must support. For each one, record the audience, required history, acceptable latency, refresh window, peak concurrency, and consequence of stale or incorrect data.
“Real time” is not a requirement until it has a number. Five seconds, five minutes, and one hour produce very different designs and operating costs.
2. Map sources and change behavior
Create a source register that includes ownership, keys, deletion behavior, expected volume, schema-change process, and extraction limits. Decide how inserts, updates, and deletes will be captured. Plan for backfills before the first pipeline fails.
3. Choose batch, CDC, or streaming per use case
Use batch for predictable snapshots and cost-efficient bulk movement. Use CDC when database changes need to arrive incrementally. Use streaming when the decision loses value quickly and the team can operate event ordering, duplication, replay, and late-data handling.
One warehouse can use all three, but each feed should have a documented reason.
4. Set raw, curated, and serving boundaries
Define where source fidelity ends, where business rules become authoritative, and where consumer-specific optimization begins. The bronze, silver, and gold data layers guide offers one practical vocabulary for these boundaries.
Keep transformations version-controlled and make lineage visible across them. A metric should be traceable from a dashboard back to its model, pipeline, and source.
5. Design models around business grain
For every fact table, write one sentence that defines what a row represents. Identify dimensions shared across departments, decide how historical attribute changes are retained, and assign owners to high-value metrics.
Avoid building a single universal table for every use case. It may look convenient initially but tends to hide grain conflicts, duplicate logic, and produce expensive scans.
6. Isolate workloads and control cost
Estimate ingestion windows, query patterns, data growth, and concurrency. Decide which workloads can share compute and which require isolation. Then test with representative data and queries.
AWS recommends a proof of concept and workload-specific evaluation because no single Redshift design practice fits every application. Its guidance also emphasizes aligning table and load design with massively parallel processing and columnar storage. Review the platform’s current warehouse best practices before committing to a physical design.
7. Design the access path with the warehouse
Choose how analysts and business teams will discover data, understand metric definitions, ask questions, and share results. The semantic model, permissions, audit trail, and query safeguards belong in the architecture review—not in a later “BI phase.”
For teams that already have a curated warehouse, GetInsights can connect directly to platforms such as Snowflake, BigQuery, Redshift, and Databricks so business users can ask questions in plain English and build dashboards without another ETL layer. Its enforced read-only query path and audit history complement the warehouse’s serving and governance controls rather than replacing them.
Example: architecture for a growing ecommerce company
Consider a retailer that needs daily finance reporting, hourly inventory visibility, and near-real-time order monitoring.
- Sources: PostgreSQL order data, a payment provider, inventory software, advertising APIs, and customer-support events.
- Ingestion: CDC for orders and inventory; streaming for operational order events; scheduled API pulls for advertising and support data.
- Raw zone: immutable, partitioned source data with load timestamps and schema history.
- Transformation: deduplication, currency normalization, customer identity resolution, refund handling, and data-quality tests.
- Warehouse models: order-line and payment facts with shared customer, product, channel, store, and date dimensions.
- Serving: a finance mart refreshed daily, inventory aggregates refreshed hourly, and an operations view updated within minutes.
- Consumption: governed dashboards, analyst SQL, alerts, and application-facing metrics with role-based access.
The architecture uses different freshness levels because the decisions have different deadlines. It preserves a common governed core while isolating serving models by purpose.
Common architecture mistakes to avoid
Starting with tools instead of decisions
A vendor reference diagram cannot tell you which metrics matter, how fresh they must be, or who owns them. Define outcomes and service levels first.
Treating staging as a dumping ground
Raw data without retention rules, discoverable metadata, or replay procedures becomes an expensive mystery. Give the raw layer an explicit contract.
Mixing grains in analytical models
Combining orders, order lines, payments, and sessions without a clear row definition leads to double counting. Declare grain before measures.
Equating job success with data quality
A pipeline can finish on time with missing rows or stale source data. Monitor freshness, volume, distribution, and business invariants separately from infrastructure health.
Letting every dashboard redefine metrics
If each report calculates revenue or active customers differently, the warehouse is centralized only physically. Put reusable definitions in governed models or a semantic layer.
Ignoring recovery and schema change
Backfills, source deletions, late events, and renamed columns are normal. Test replay, idempotency, and dependency behavior before an incident.
Sharing one compute pool indefinitely
Ingestion, executive dashboards, and exploratory analysis have different performance profiles. Monitor contention and introduce workload isolation when service levels justify it.
Architecture review checklist
Before implementation, confirm that the design can answer these questions:
- Which business decisions and users does the warehouse serve?
- What freshness, recovery, and availability targets apply to each dataset?
- How are inserts, updates, deletes, late data, and backfills handled?
- Where are raw, curated, semantic, and consumer-specific responsibilities separated?
- What is the grain and owner of every critical fact and metric?
- How are lineage, quality, access, audit, retention, and sensitive fields governed?
- Which workloads share compute, and which are isolated?
- How will costs be attributed and controlled?
- Can a failed load be replayed safely?
- Can a user trace a dashboard number back to its source?
If several answers are “we will decide later,” the architecture is not ready for a platform selection.
Frequently asked questions
What is the basic architecture of a data warehouse?
The basic architecture moves data from source systems through ingestion and transformation into warehouse storage, then exposes curated data through a serving layer to BI tools and applications. Governance, metadata, security, quality, and monitoring operate across all of those layers.
What is the three-tier architecture of data warehousing?
The bottom tier contains data acquisition, staging, and warehouse storage. The middle tier processes analytical queries through OLAP, query, or semantic services, while the top tier provides reports, dashboards, notebooks, and other user-facing tools.
What is ETL in data warehouse architecture?
ETL means extract, transform, and load. It retrieves data from source systems, cleans and standardizes it according to business rules, and loads the result into the warehouse; ELT loads data before running most transformations in the target platform.
What are the main components of a modern data warehouse?
Most modern designs include sources, batch or streaming ingestion, raw or staging storage, transformation and quality controls, curated warehouse models, a semantic or serving layer, and consumption tools. Metadata, governance, security, orchestration, and observability connect the components.
Should a data warehouse use batch or streaming ingestion?
Use batch when decisions tolerate scheduled updates and bulk loading is simpler and cheaper. Use streaming when seconds or minutes materially change the outcome and the team can operate replay, ordering, duplication, and late-arriving events; many warehouses use both.
What is the difference between data warehouse architecture and data architecture?
Data architecture covers the organization’s broader data ecosystem, including operational databases, integration, governance, lakes, warehouses, applications, and ownership. Data warehouse architecture focuses on the analytical path that integrates historical data and serves reporting, BI, and related workloads.
Conclusion: choose boundaries before products
The architecture of data warehousing is not a fixed stack. It is a set of deliberate boundaries that turn operational data into reliable, governed, and usable analytical products.
Start with decisions, freshness, grain, ownership, and recovery. Then select tiering, ingestion, storage, modeling, and serving patterns that satisfy those constraints with the fewest moving parts. If your warehouse is already curated and the remaining bottleneck is governed access for business users, evaluate the consumption layer next and test it with real questions, permissions, and concurrent workloads.
Ask your data a question instead
Connect your database and ask in plain English. GetInsights writes the SQL, runs it read-only, and hands you the chart and dashboard.
Start for free