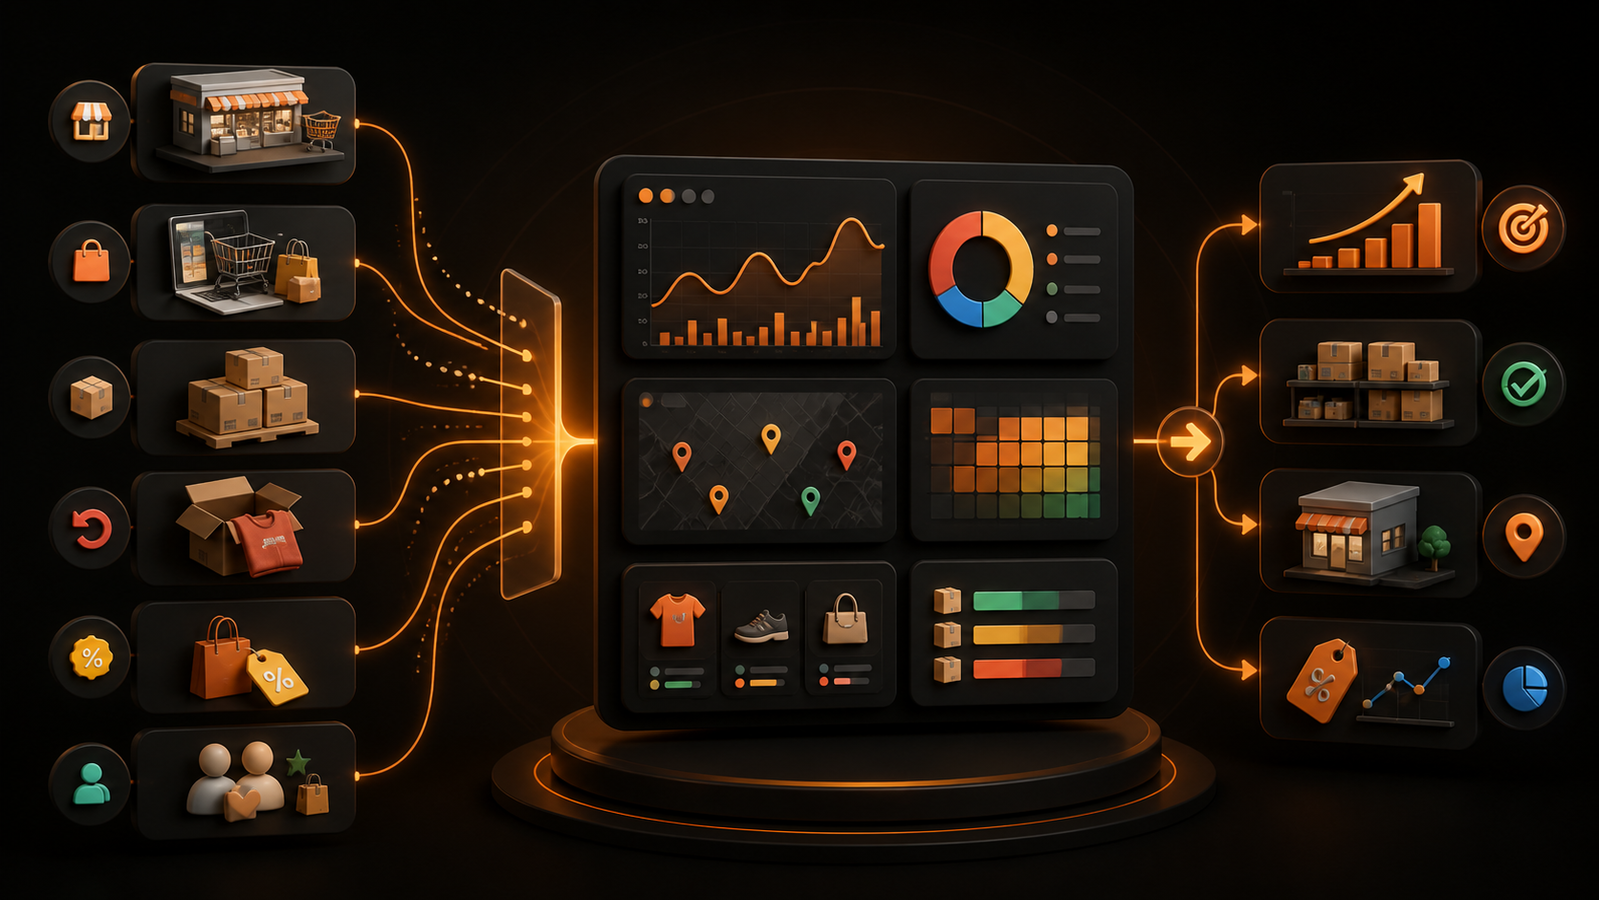
Business Intelligence for Manufacturing: A Practical Guide
Manufacturing BI should do more than display plant KPIs. This practical guide maps production questions to data, metrics, actions, security controls, and a focused 90-day pilot.

When production, quality, maintenance, inventory, and finance each report a different version of plant performance, the problem is rarely a shortage of data. It is the distance between a shop-floor event and the person who can act on it. Business intelligence for manufacturing closes that distance by turning data from operational and business systems into consistent metrics, explanations, and decisions.
The goal is not another wall of charts. It is a reliable way to answer questions such as: Why did yesterday's output miss plan? Which downtime cause is growing? Which orders are at risk? Where is scrap eroding margin? This guide shows where manufacturing BI creates value, which data it needs, and how to launch a focused pilot without creating a risky connection back into plant controls.
What is business intelligence for manufacturing?
Business intelligence for manufacturing is the process of combining, analyzing, and visualizing data from production and enterprise systems so teams can make faster operational and commercial decisions. It connects measures such as machine state, output, defects, work orders, inventory, cost, and delivery performance to a shared business context.
That definition matters because a BI layer is not the same thing as an MES, ERP, SCADA platform, historian, or control system. Those applications execute or record specific processes. BI reads from their approved data surfaces, aligns identifiers and definitions, and lets users compare performance across time, products, lines, plants, and customers.
The result should be a decision loop:
- Detect a meaningful deviation.
- Diagnose it at the right level of detail.
- Assign an action to an owner.
- Measure whether the action worked.
If a dashboard stops after step one, it is monitoring—not yet business intelligence.
Where business intelligence for manufacturing creates value
The best starting point is a repeated decision with measurable consequences, not a broad mandate to "become data-driven." Choose a question that currently requires spreadsheet assembly, several system exports, or a long wait for an analyst.
| Decision area | Question BI should answer | Typical data | Useful measures and next action |
|---|---|---|---|
| Production | Why did actual output miss plan? | MES, machine states, schedules, labor | Throughput, cycle time, schedule attainment; investigate the largest loss by line, shift, product, or reason code |
| Equipment | Which assets are becoming less reliable? | Historian, SCADA, CMMS, work orders | Availability, downtime duration, MTBF, MTTR; inspect recurring fault patterns or adjust maintenance priority |
| Quality | Where are defects and rework originating? | QMS, inspections, genealogy, process parameters | First-pass yield, scrap, rework, defect rate; isolate the product, process step, material lot, or supplier |
| Inventory | Which shortages will interrupt the schedule? | ERP, WMS, MRP, production plan | Days on hand, stockout risk, inventory turns; expedite, substitute, or resequence work |
| Supply chain | Which supplier or lane threatens delivery? | Purchase orders, receipts, logistics events | Supplier on-time delivery, lead-time variance, fill rate; escalate exceptions or revise safety stock |
| Energy | Where is consumption detached from output? | Meters, historian, production counts | Energy per good unit, idle consumption, peak demand; investigate baseload or equipment-state anomalies |
| Cost and margin | Which jobs or products consume more than expected? | ERP, routing, labor, material, scrap | Actual versus standard cost, variance, contribution margin; review routing, quote, or process loss |
| Customer delivery | Which orders are likely to ship late? | ERP, MES, inventory, logistics | On-time-in-full, backlog age, remaining cycle time; prioritize constraints and communicate risk |
Production and OEE: use the components, not only the score
Overall equipment effectiveness can summarize availability, performance, and quality. AWS's worked OEE example defines the metric as the product of those three factors and warns that misaligned update timestamps can produce incorrect values. That warning is important: a mathematically correct formula can still mislead when its inputs refer to different intervals.
Do not rank lines by OEE and stop. Expose the components, planned time rules, ideal rate, reason codes, and data freshness. A plant manager needs to know whether the loss came from a changeover, a recurring fault, micro-stops, reduced speed, or rejected units—and whether the comparison is fair.
Quality: connect defects to production context
A defect total becomes actionable when the user can move from plant to line, work order, SKU, lot, process step, supplier, shift, and parameter range. Preserve genealogy keys and inspection timestamps. Without them, teams can see that quality deteriorated but cannot test likely causes.
Start with descriptive and diagnostic analytics. Predictive quality is valuable only after teams trust defect codes, good-unit counts, process limits, and the relationships among material, machine, method, and operator context.
Maintenance: combine condition and work history
Machine signals show what changed; CMMS records show what technicians found and did. Combining both can reveal repeated faults, long waits for parts, assets with rising repair frequency, and preventive tasks that do not reduce failure risk. Keep the first use case practical: prioritize an inspection or improve a weekly maintenance plan before attempting autonomous predictions.
Inventory, supply, and delivery: show the chain of consequence
A shortage dashboard is more useful when it identifies affected work orders, promised dates, substitute materials, and revenue at risk. The same principle applies to supplier performance: lead-time variance matters because it changes the production plan or customer commitment.
Cross-functional visibility is where business intelligence in manufacturing becomes business intelligence rather than plant reporting. It joins an operational signal to an economic or customer outcome.
Energy: normalize consumption by what the plant produced
Raw utility totals often follow production volume. Compare energy with good output, equipment state, product mix, weather where relevant, and scheduled hours. The U.S. Department of Energy's Better Plants program explicitly organizes industrial improvement around measured energy intensity, water, waste, and reported progress.
A documented 3M implementation combined metering with production, runtime, and weather data, then used department filtering and alerts to investigate deviations. The DOE case study is a useful model because the analytics were tied to operating changes such as leak repair and idle-state reduction—not treated as reporting alone.
Build a manufacturing BI data map before a dashboard
Manufacturing data spans systems with different purposes, owners, identifiers, and time horizons. The ISA-95 enterprise-control integration model gives teams a shared vocabulary: physical processes and sensing sit below supervisory control and manufacturing operations, while ERP and business planning sit at the enterprise level. BI often crosses these boundaries, but it should not erase them.
Create a one-page map for the pilot:
| System | Role in the pilot | Critical context to retain |
|---|---|---|
| PLC, SCADA, or historian | Machine state and process signals | Asset ID, event time, quality flag, unit, sampling method |
| MES | Production execution | Work order, operation, line, shift, product, counts, reason codes |
| QMS or LIMS | Inspection and nonconformance | Specification, result, defect, disposition, lot, sample time |
| CMMS or EAM | Maintenance work | Asset, failure mode, work type, technician notes, parts, duration |
| ERP or MRP | Plan and financial context | Order, material, routing, standard cost, promise date, customer |
| WMS or supply platform | Inventory and movement | Location, lot, quantity, status, receipt, pick, shipment |
For every join, name the system of record and transformation owner. Resolve common traps early: asset names that differ between MES and CMMS, local timestamps mixed with UTC, changing product routings, quantities stored in incompatible units, and late-arriving quality results.
You do not need to centralize every raw signal to launch. Create analysis-ready views or tables for the chosen decision, with a declared grain and tested keys. If the organization needs a repeatable pattern for separating raw, validated, and consumption-ready data, a bronze, silver, and gold data-layer design provides a useful starting structure.
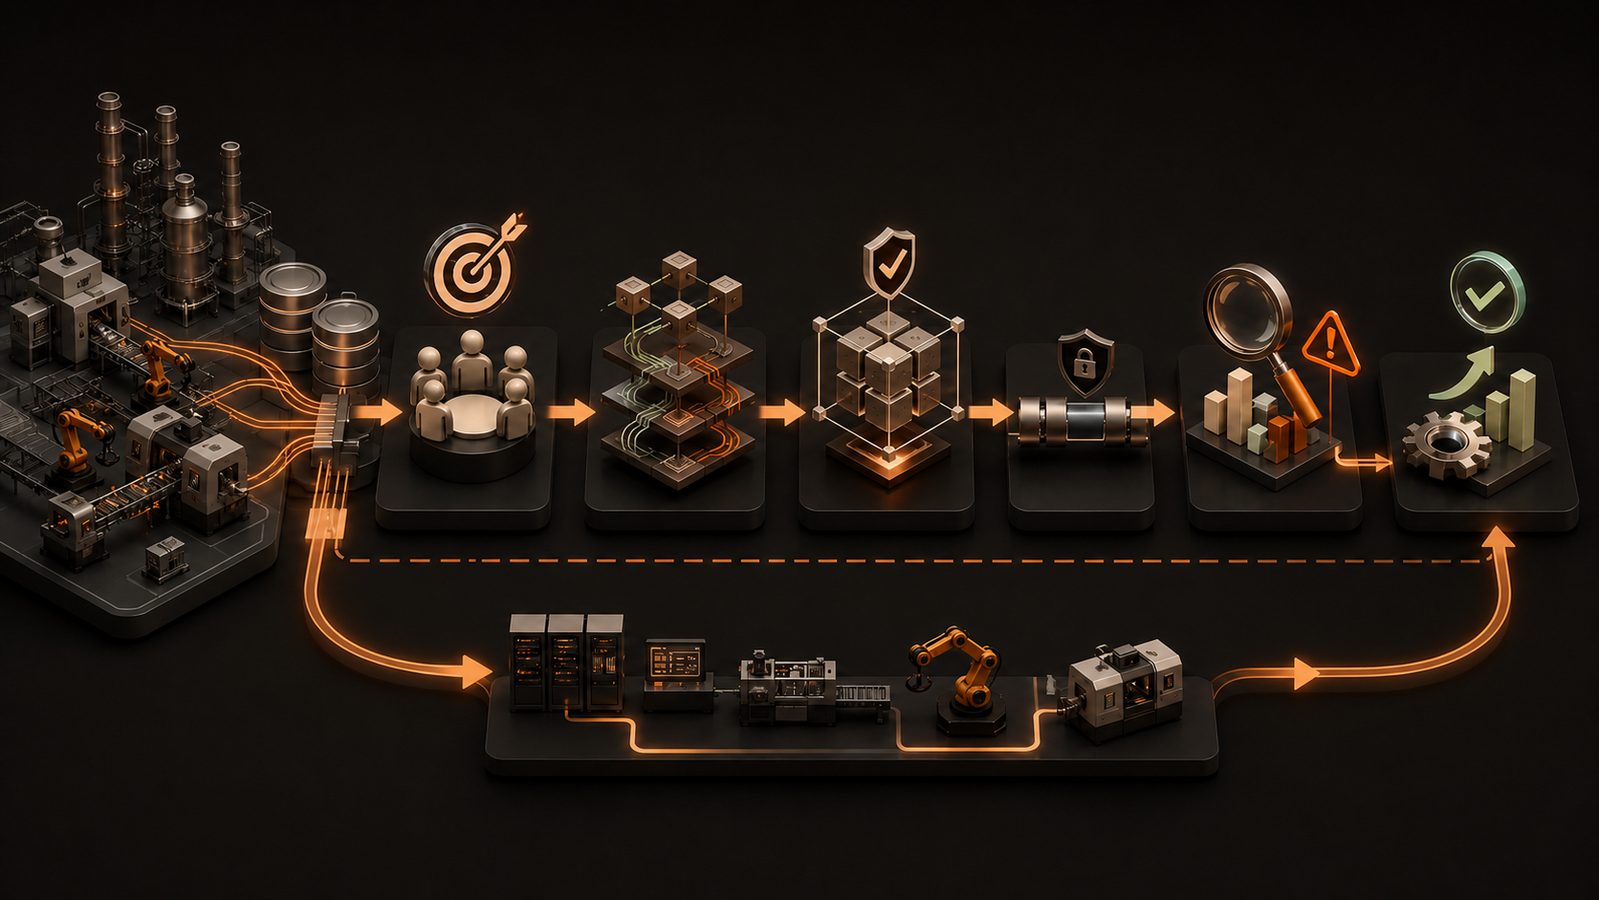
How to implement business intelligence for manufacturing in 90 days
A 12-week pilot is long enough to validate data and user behavior, but short enough to resist a plant-wide platform rebuild. Use a single value stream, line, product family, or plant and one primary decision.
Weeks 1–2: write a decision contract
Define the user, decision, current delay, baseline, and action. A good contract is specific: "The morning production meeting will identify the top controllable cause of lost output on Line 4 and assign one countermeasure before 10 a.m."
Document the target measure and guardrails. Who can see customer or employee data? How fresh must the information be? What happens when data is missing? What must remain outside the pilot?
Weeks 3–4: map sources and metric definitions
Inventory only the fields needed for the decision. For each measure, record its formula, grain, timezone, inclusion rules, refresh expectation, owner, and exception behavior. Give ambiguous concepts operational definitions: Does downtime include breaks? Does "good" mean produced, inspected, or released? Which promise date defines on-time delivery?
This metric contract is more valuable than an early mockup. It prevents two polished charts from disagreeing for reasons no user can see.
Weeks 5–6: build a read path and validation set
Extract or query data through approved interfaces. Keep analytical access separate from control pathways and use least-privilege, read-only identities where possible. NIST notes that connecting operational technology with IT improves business capability but also expands the attack surface; its manufacturing cybersecurity practice guide emphasizes integrity monitoring, access controls, change management, and network monitoring.
Create a small validation set of known shifts, orders, stops, and defects. Reconcile totals with source-system reports and investigate differences rather than averaging them away.
For a lean team whose approved manufacturing data already lands in a supported database, GetInsights can be evaluated as a direct, read-only path from plain-English questions to SQL, charts, and shareable dashboards without adding an ETL project. Its enforced write blocking and query history are especially relevant when business users need follow-up analysis but must never send changes back to operational data.
Weeks 7–8: prototype around exceptions
Build the smallest useful flow: a summary, an exception list, and a drill path. Put thresholds, targets, comparison periods, units, and last-refresh time in context. Default views should answer "Where should I look?" before offering dozens of filters.
Test with real meeting questions. If users export everything to a spreadsheet, ask what calculation, annotation, or comparison the BI experience failed to support.
Weeks 9–10: run parallel and close the loop
Use the new view alongside the current process for several operating cycles. Record discrepancies, questions, decisions, owners, and outcomes. Do not declare success because users opened the dashboard; measure time saved, exception response, schedule recovery, scrap avoided, or another result connected to the original decision.
Weeks 11–12: harden, train, and decide
Add data-quality checks, refresh monitoring, access reviews, ownership, and support procedures. Train each role on the decisions it owns, not every feature in the tool.
At the end, choose deliberately: scale the pattern, revise the metric or workflow, or stop. A pilot that disproves a weak use case before a broad rollout is still useful.
How to choose manufacturing business intelligence software
The right product fits the data boundary and operating workflow. Evaluate candidates with a short proof using your own definitions and representative data.
Data and integration fit
- Can it connect to the approved database, warehouse, lakehouse, or replicated operational store?
- Can it preserve event time, units, asset hierarchy, work-order grain, and late-arriving records?
- Does it require copying data, and if so, how are freshness, retention, and deletion managed?
- Can it work with existing semantic models and governed views?
Analysis and usability fit
- Can supervisors move from a KPI to the shifts, assets, products, and reason codes behind it?
- Can non-technical users ask follow-up questions without bypassing metric definitions?
- Are alerts based on meaningful exceptions rather than arbitrary chart thresholds?
- Does the mobile or floor experience work in the environment where decisions happen?
Governance and operational fit
- Can access be limited by role, plant, customer, or product where necessary?
- Are queries, exports, shares, model changes, and failed refreshes auditable?
- Can analytical identities be enforced as read-only?
- Who owns the semantic model, data quality, platform administration, and incident response?
Economic fit
Model the total cost of connections, infrastructure, implementation, licenses, training, support, and ongoing data engineering. Then compare that cost with one or two measurable decisions. A lower license price is not cheaper if every new question becomes a consulting project; a sophisticated platform is not better if the target users avoid it.
For broader program sequencing, use a BI strategy roadmap to connect the first manufacturing use case to governance, ownership, and future expansion.
Common manufacturing BI failures to prevent
Building a dashboard before defining the decision
This produces a crowded KPI inventory with no owner or response. Require every prominent measure to have a user, threshold or comparison, drill path, and expected action.
Making every source "real time"
Seconds matter for some machine conditions; daily updates may be adequate for margin or supplier reviews. Set freshness from the decision window. Unnecessary streaming adds cost and can create false precision when other sources update slowly.
Comparing inconsistent operations
Product mix, ideal rates, planned time, routings, and inspection policies can make line or plant rankings unfair. Let users see the context and stratify before comparing.
Treating AI output as plant truth
AI can help explain anomalies, search data, forecast risk, and surface patterns. But the NIST 2026 smart-manufacturing roadmap highlights persistent challenges in industrial data management, heterogeneous-system integration, explainability, reliability, and safe operation. Keep governed inputs, transparent calculations, human review, and clear limits around high-stakes actions.
Connecting analytics back to controls casually
A BI question should not become an unreviewed command to a PLC, MES, or ERP. Separate observation from actuation. Any automated response belongs in an engineered, tested, authorized control or workflow layer with appropriate safety and cybersecurity review.
Frequently asked questions
What is manufacturing intelligence?
Manufacturing intelligence is the broader capability to turn plant and enterprise data into operational knowledge and action. It can include BI dashboards, event monitoring, statistical analysis, AI, digital twins, and workflow automation. Manufacturing BI is the reporting, exploration, and decision-support layer within that broader capability.
What are the five stages of business intelligence in manufacturing?
A practical five-stage loop is collect, contextualize, analyze, act, and learn. Collect approved data; contextualize it with assets, products, orders, and time; analyze changes and causes; assign an action; then measure the result and improve the model. The stages repeat rather than ending with a report.
Which KPIs should a manufacturing BI dashboard include?
Choose KPIs from the decision being made. Common measures include throughput, cycle time, schedule attainment, availability, OEE components, first-pass yield, scrap, rework, MTBF, MTTR, inventory turns, supplier on-time delivery, energy per good unit, cost variance, and on-time-in-full. A focused role-based dashboard is usually more useful than putting all of them on one page.
How can AI be used in a manufacturing business?
AI can support anomaly detection, predictive maintenance, visual inspection, demand forecasting, scheduling, root-cause exploration, natural-language data questions, and knowledge retrieval. Start with a bounded decision, validated data, a measurable baseline, and human review. Do not let a probabilistic answer bypass safety, quality, or change-control procedures.
Can business intelligence connect ERP and shop-floor data?
Yes. BI can combine business context from ERP with production context from MES, historians, quality, maintenance, and warehouse systems through approved interfaces or analysis-ready stores. Use shared identifiers, explicit definitions, aligned timestamps, and a security design that respects the boundary between enterprise IT and operational technology.
Does a manufacturer need a data warehouse before using BI?
Not always. A focused pilot can query governed database views, a replicated operational store, or an existing warehouse. A warehouse or lakehouse becomes more valuable when the team needs durable history, multi-system conformance, reusable metrics, higher concurrency, or isolation from transactional workloads.
Turn plant data into one accountable decision
Start business intelligence for the manufacturing industry with a question that already costs time, output, material, energy, or customer trust. Define the decision and metric before choosing the visualization, connect only the data required, and validate the result with the people who run the process.
Then judge the pilot by action: Did the team find the loss sooner, agree on its cause, assign a response, and confirm the outcome? If the answer is yes, you have a repeatable BI pattern worth scaling to the next line, plant, or value stream. If non-technical teams need a safe way to explore approved operational data, evaluate a read-only conversational BI pilot against that exact workflow.
Ask your data a question instead
Connect your database and ask in plain English. GetInsights writes the SQL, runs it read-only, and hands you the chart and dashboard.
Start for free