
Retail Analytics Platform: 12 Features to Compare
A retail analytics platform should improve a real merchandising or operations decision—not merely add dashboards. Use this 12-feature checklist, pilot plan, and weighted scorecard to compare your options with evidence.
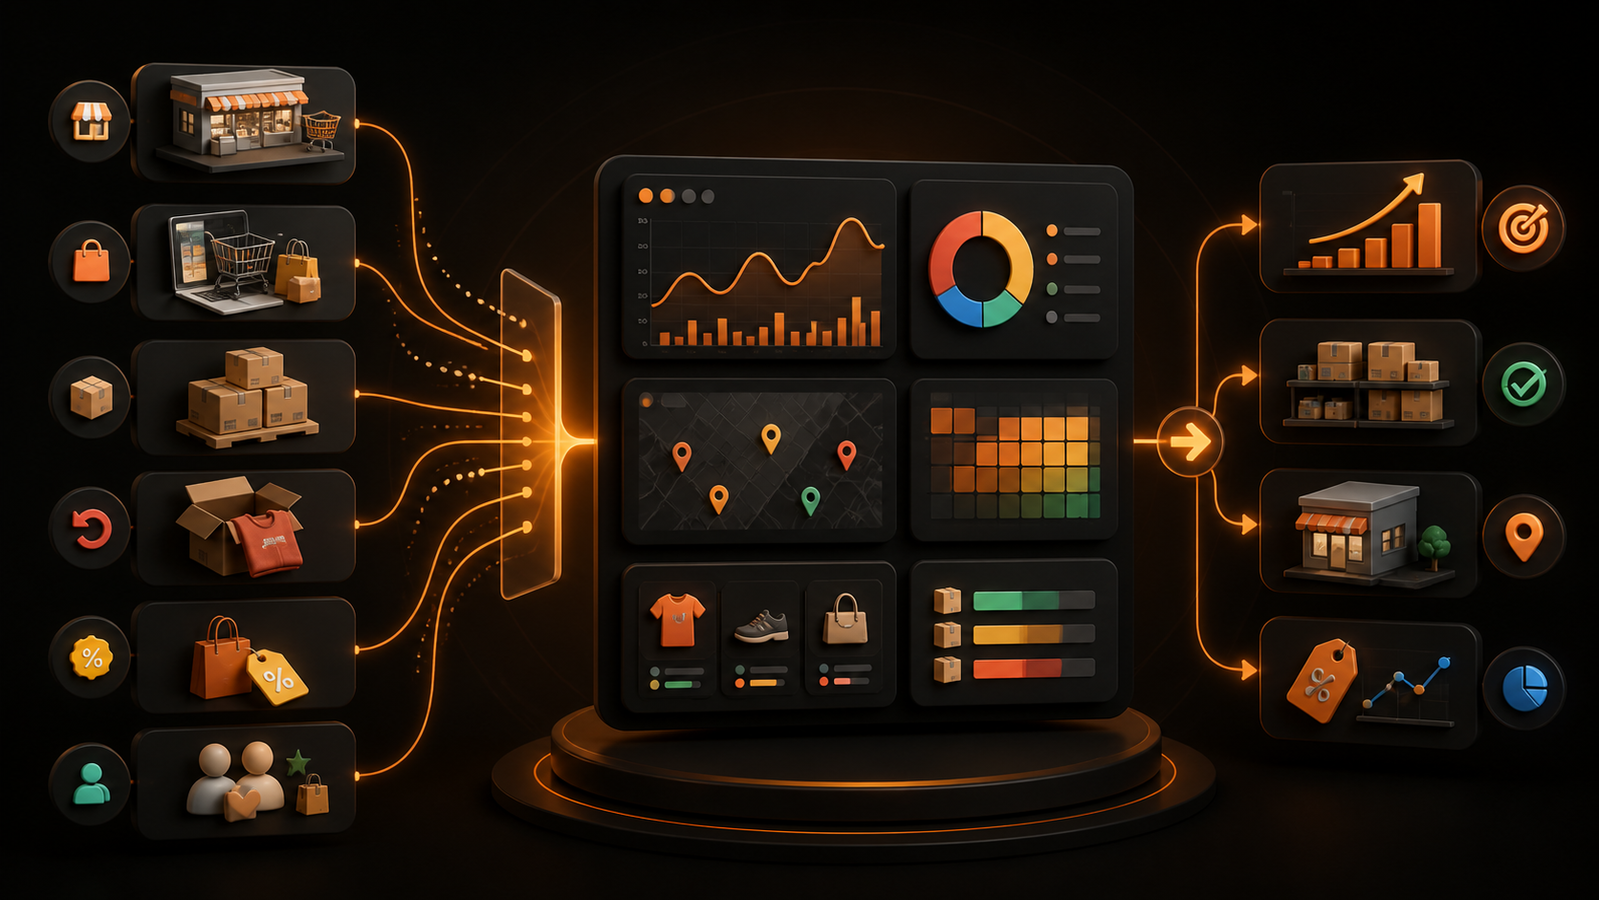
Retail teams rarely suffer from a lack of reports. The harder problem is that sales, inventory, returns, promotions, ecommerce, loyalty, and store operations often tell different versions of the same day. A retail analytics platform should turn those fragmented signals into decisions that merchandising, operations, finance, and marketing can trust—not simply add another dashboard.
That makes a buying decision more demanding than comparing chart libraries. You need to know whether each platform fits your data, preserves retail context, defines metrics consistently, supports the people who will use it, and produces answers fast enough to change an order, promotion, price, or staffing plan. This guide gives you a practical feature checklist, proof-of-concept plan, and scorecard for making that comparison.
What is a retail analytics platform?
A retail analytics platform is software that combines and analyzes retail data so teams can monitor performance, investigate changes, forecast outcomes, and make operational decisions. It typically works with transaction, product, inventory, customer, marketing, and supply-chain data, then presents the results through dashboards, alerts, forecasts, or natural-language questions.
The category is broad. Intel's overview of retail analytics includes point-of-sale systems, CRM platforms, business intelligence tools, inventory systems, and predictive AI solutions in the retail analytics stack. Some products are suites with retail planning workflows; others are general BI platforms, warehouse-native analytics layers, ecommerce applications with built-in reporting, or specialist tools for pricing, demand, footfall, and customer behavior.
The right category depends on the decision you need to improve. A single-store operator may be well served by built-in POS and ecommerce reports. A multi-location or omnichannel retailer may need a separate analytics layer when questions cross systems, definitions differ by team, or decision-makers keep waiting for custom exports and analyst-built reports.
Start with retail decisions, not a feature list
Before you compare retail analytics software, write down the decisions the platform must support. This prevents a polished demo from turning a vague wish list into an expensive implementation.
Use a decision inventory like this:
| Decision | Question the platform must answer | Required grain | Likely action |
|---|---|---|---|
| Replenishment | Which SKU-location combinations will stock out before the next delivery? | SKU, store, day | Reorder, transfer, or expedite |
| Assortment | Which products deserve more or less shelf space? | SKU, category, store cluster, week | Expand, reduce, or localize assortment |
| Promotion | Did the campaign create incremental margin after discount and cannibalization? | SKU, store/channel, customer segment, day | Repeat, redesign, or stop the offer |
| Pricing | Where are price changes hurting unit velocity or margin? | SKU, location/channel, effective period | Review the price or markdown rule |
| Store operations | Which locations are missing plan, and what changed? | Store, department, hour/day | Adjust labor, stock, layout, or execution |
| Customer retention | Which valuable customers are becoming less active? | Customer or cohort, order, channel | Trigger an approved retention action |
| Returns | Which products, suppliers, or channels drive avoidable returns? | Order line, SKU, reason, supplier | Fix content, quality, fit, or policy |
| Executive planning | Are sales, margin, inventory, and cash moving together? | Banner, region, category, month | Reallocate budget or inventory |
For each row, name the decision owner, current process, acceptable data delay, and financial or operating measure that should change. “Real time” is not automatically better. A stockout alert may need near-real-time data, while assortment planning may work well with a validated daily refresh.
This decision-first approach also exposes category fit. If the priority is vendor-funded promotion settlement, you may need specialized trade-promotion capabilities. If the priority is letting store and category leaders explore governed warehouse data, self-service BI may be the better fit. If the problem is basic sales visibility in one commerce system, its native analytics may be enough.
Retail analytics platform feature checklist
The most useful comparison covers twelve capabilities. They are connected: impressive AI cannot rescue unreliable product keys, and a perfect data model creates little value if business users cannot reach an answer.
1. Data-source coverage and connection method
List the sources required by your decision inventory: POS, ecommerce, ERP, WMS, order management, product information, loyalty, CRM, advertising, workforce, footfall, marketplace, and external data. Then distinguish “has a connector” from “can support our use case.”
Ask each vendor:
- Does the connector expose line-item details, adjustments, returns, discounts, taxes, costs, and fulfillment events?
- Is data copied into the vendor's store, queried in place, or both?
- What is the normal and worst-case freshness?
- How are schema changes, deleted records, late events, and API limits handled?
- Can you connect governed database views without rebuilding an existing data pipeline?
- Who monitors failures, and how are users notified when data is stale?
The architecture affects implementation time, cost, security scope, and the chance that two systems drift apart. Demand a lineage view from source to metric, not just a grid of integration logos.
2. Retail data model and identity resolution
Retail analysis depends on consistent identifiers and hierarchies. A platform should preserve SKU and variant, product and category, store and region, order and order line, customer and household where permitted, supplier, channel, currency, promotion, and time.
This is where generic demos often break. A red shirt may be one product, several size-color variants, and many store-level inventory positions. A return may occur in a different channel from the original sale. A category hierarchy can change while historical reporting still needs the old rollup.
GS1's Global Data Model exists to harmonize product-data exchange and improve accuracy and completeness across channels. Your platform does not have to require GS1, but it should be able to retain standardized product identifiers and map local identifiers without losing history.
Test slowly changing hierarchies, duplicate customers, bundle components, marketplaces, franchise locations, and cross-channel returns. If the vendor cannot show how those cases are modeled, the resulting retail dashboards may reconcile at the top line but fail when a manager drills into the detail.
3. Metric governance and reconciliation
Ask the same apparently simple question in several systems: “What were net sales last week?” Differences emerge around tax, shipping, gift cards, canceled orders, returns timing, currency conversion, employee sales, and channel attribution.
A retail analytics platform should provide:
- documented metric definitions, owners, and calculation logic;
- a semantic or governed metrics layer reused across dashboards and questions;
- versioning or change history for definitions;
- certified data sets and clear warnings for exploratory ones;
- filters that behave consistently across store, category, channel, and time;
- reconciliation workflows back to source totals;
- visible refresh timestamps and data-quality status.
Do not approve a platform because its demo totals match a spreadsheet once. Reconcile multiple periods that include refunds, partial fulfillments, promotions, and a month or quarter boundary. Then change a metric definition and observe how the platform identifies affected reports.
4. Inventory and merchandising analysis
Retail analytics software should support the grain at which inventory decisions happen: SKU by location by time. Useful measures include on-hand and available-to-promise units, sell-through, weeks or days of supply, stock-to-sales ratio, inventory turn, aged stock, stockout duration, lost-sales proxy, markdown exposure, and gross margin return on inventory.
Look beyond a current inventory snapshot. Can users reconstruct inventory position at an earlier date? Can they separate unavailable, reserved, in-transit, damaged, and safety stock? Can they see whether a demand spike is broad or isolated to a store cluster? Can the platform connect a stockout risk to an open purchase order or transfer opportunity?
A strong demo should follow one exception from banner to region to store to SKU, then show the event and source record behind it. That proves more than a colorful “inventory health” score.
5. Omnichannel sales and customer analysis
An omnichannel view must represent journeys rather than merely place store and ecommerce revenue side by side. Test buy-online-pick-up-in-store, ship-from-store, online returns in store, marketplace orders, gift cards, exchanges, and loyalty activity across channels.
Customer analysis adds privacy and identity complexity. Ask how anonymous and known activity is separated, how consent and deletion requests propagate, how matching confidence is represented, and whether users can access only the level of personal data their job requires.
The goal is not to force every interaction into a perfect customer record. It is to make the limitations visible. A cohort with incomplete identity coverage should not be presented with the same confidence as fully linked transactions.
6. Promotion, pricing, and margin analysis
Revenue lift alone can make a promotion look successful while margin, returns, or demand shifted from a neighboring product. Compare support for regular price, markdown, coupon, loyalty offer, vendor funding, cost, and promotion calendar data.
Ask whether the platform can distinguish:
- gross lift from incremental lift;
- units gained from margin surrendered;
- target-product performance from halo and cannibalization;
- planned promotions from actual execution;
- sales during an in-stock period from sales constrained by a stockout;
- nominal sales change from quantity and price effects.
The product does not need to solve causal inference automatically, but it should preserve the inputs and comparison groups needed for a defensible analysis. Beware a black-box “promotion ROI” metric whose assumptions cannot be inspected.
7. Self-service exploration and natural-language questions
Self-service means a category manager can answer an approved follow-up without rebuilding the metric or asking an analyst to export another file. Evaluate the full path from question to decision:
- Can the user find a trusted starting point?
- Can they filter, compare, drill, and explain a change?
- Does the interface protect governed definitions?
- Can they save and share the analysis with context?
- Can an analyst inspect the query and reproduce the result?
Natural-language analytics can lower the skill barrier, but only if the system reveals how it interpreted the question. Test ambiguous retail language such as “best stores,” “top products,” “last season,” and “active customers.” The platform should ask for clarification or expose assumptions rather than silently choose a measure.
Also test failure behavior. Ask a question the data cannot answer. A trustworthy product says what is missing; an unsafe one returns a plausible chart anyway.
8. Dashboards, alerts, and operational delivery
Retail dashboards serve different moments: a daily store huddle, a weekly category review, an executive plan update, and an urgent stockout exception. Compare role-based home pages, mobile usability, scheduled delivery, subscriptions, comments, exports, embedding, and alert routing.
Alerts need context and ownership. A useful alert identifies what changed, its size, the affected entities, data freshness, a likely next step, and the person or workflow responsible. Without thresholds, suppression, and escalation rules, “real-time analytics” becomes notification fatigue.
Ask users to complete real tasks on a laptop and phone. A feature shown by the vendor is not adopted until the intended user can find it, understand it, and act without a guided tour.
9. Forecasting, anomaly detection, and AI controls
Demand forecasting should match the level and horizon of the decision. A replenishment forecast may require SKU-location-day output, while financial planning may use category-month estimates. Compare seasonality, promotions, product launches, stockout-censored demand, intermittent sales, holidays, local events, weather, and new-item handling.
Request backtests rather than a single accuracy headline. Review error by category, location, horizon, and business impact. Confirm which baseline the model beats, how often it retrains, how overrides are recorded, and what happens when input data is late.
For anomaly detection and generative AI, compare explainability, human approval, monitoring, audit history, and controls over training or retention of your data. The NIST AI Risk Management Framework organizes AI risk work around governing, mapping, measuring, and managing risk across the lifecycle. Those are useful headings for vendor questions even when the use case is a conventional sales forecast rather than generative AI.
10. Security, privacy, and access control
Retail data can include payment, employee, supplier, and customer information. Security therefore belongs in the feature comparison, not in a procurement appendix after a preferred product is chosen.
At minimum, examine single sign-on, multi-factor authentication, role- and attribute-based access, row- and column-level controls, encryption, audit logs, session management, secure exports, data residency, retention, incident response, subprocessors, and independent assurance reports. Test whether a regional manager can see only approved stores and whether sensitive columns remain protected in downloads and natural-language answers.
PCI DSS provides baseline technical and operational requirements for entities that store, process, transmit, or can affect the security of payment account data. Do not assume a vendor's PCI statement makes your whole analytics deployment compliant. Confirm whether payment data enters the platform at all, which party owns each control, and how the architecture changes your cardholder-data environment.
Privacy requires a separate review. NIST describes its Privacy Framework as a voluntary tool for identifying and managing privacy risk while protecting individuals. Ask the vendor to support data inventories, purpose limits, deletion, consent signals, de-identification, and evidence that access policies work throughout exports, caches, AI features, and support processes.
11. Performance, reliability, and scale
“Fast” should be measurable in your environment. Define acceptable response time for a store dashboard, a multi-year category query, an executive refresh, and a concurrent Monday-morning workload. Then test with realistic row counts, joins, and security filters.
Compare query caching, incremental refresh, workload isolation, concurrency management, failure recovery, uptime commitments, regional availability, observability, and support response. If the platform queries a production database directly, confirm limits, timeouts, replicas, and protection against expensive or write-capable queries.
Freshness is part of reliability. The U.S. Census Bureau's Monthly Retail Trade reporting explicitly documents adjustment and revision in its official estimates. Your internal reports also need visible timing and revision rules, so users can tell a live operational figure from a closed financial period or a later restatement.
12. Implementation effort and total cost
License price is only one cost. Compare data engineering, connectors, warehouse compute, implementation services, semantic-model work, dashboard development, administration, training, support, AI consumption, embedded usage, and the cost of changing or leaving the product.
Ask vendors for a written responsibility matrix. Who builds source mappings? Who validates metrics? Who maintains connectors? Who handles failed refreshes? Who trains users? What requires paid services? What can your team export if the contract ends?
Estimate value with the same discipline. Time saved is useful, but stronger measures include fewer stockout days, lower aged inventory, faster promotion intervention, reduced manual reconciliation, higher report adoption, and shorter time from question to approved action.

How to compare a retail analytics platform in a pilot
A pilot should test the riskiest assumptions with your data and users. It is not a vendor beauty contest or a miniature enterprise rollout.
Step 1: Choose one decision and define success
Select a repeated, valuable decision with a clear owner. Examples include preventing stockouts for a priority category, explaining weekly store variance, or evaluating promotions for one banner.
Record the current baseline:
- time from question to answer;
- analyst and business-user effort;
- data latency and reconciliation issues;
- frequency of the decision;
- operational or financial outcome;
- current user confidence.
Define a pass condition before seeing the demo. For example: “A category manager can identify the ten highest-risk SKU-location combinations, inspect the contributing sales and supply signals, and export an approved action list in under ten minutes using data refreshed by 7 a.m.”
Step 2: Prepare a representative data slice
Use enough history to include promotions, returns, stockouts, holidays, hierarchy changes, and late-arriving data. Include at least one imperfect source; pristine sample data conceals the work that determines real implementation time.
Create a reconciliation pack with several known totals and edge cases. Document the expected grain, time zone, currency, return logic, product hierarchy, and access rules. Do not send payment or personal data that the pilot does not require.
Step 3: Use the same scenario for every vendor
Give vendors the decision statement, data dictionary, security constraints, and desired output. Ask each to demonstrate:
- source connection and refresh monitoring;
- metric definition and reconciliation;
- dashboard or question workflow;
- drill-through to supporting records;
- row-level access for two user roles;
- handling of one missing or ambiguous field;
- an alert or shared decision output;
- the steps needed to change a definition.
Keep a short unassisted portion. Let actual users answer two follow-up questions without the vendor driving. Observe where they hesitate, what they misinterpret, and whether the platform helps them recover.
For retailers whose approved data already sits in PostgreSQL, Snowflake, BigQuery, Redshift, Databricks, or another supported database, GetInsights' retail and logistics analytics experience offers a focused version of this model: connect read-only, ask plain-English questions, and build shareable dashboards without creating a new ETL project. It is worth testing when the primary gap is safe self-service over existing data rather than a full merchandising or planning suite.
Step 4: Score evidence, not promises
Use a weighted scorecard agreed before the demonstrations. A practical starting point is:
| Criterion | Suggested weight | Evidence to collect |
|---|---|---|
| Decision and retail-workflow fit | 20% | User completes the chosen task correctly |
| Data fit and model fidelity | 20% | Required sources, grain, history, and edge cases work |
| Metric trust and governance | 15% | Reconciliation passes; logic and lineage are visible |
| Usability and adoption | 15% | Target users complete unassisted questions |
| Security and privacy | 15% | Access tests, architecture, and control evidence pass |
| Performance and reliability | 5% | Response time, refresh, and failure handling meet targets |
| Implementation and operations | 5% | Named owners, realistic timeline, and support model |
| Three-year total cost | 5% | Comparable license, services, compute, and staffing estimate |
Weights should change with the use case. A customer analytics project may raise privacy and identity resolution. A store-operations dashboard may raise mobile experience and freshness. A planning deployment may raise forecasting and workflow fit.
Step 5: Close with an implementation decision
End the pilot with one of four explicit outcomes: proceed, proceed with conditions, test a remaining risk, or stop. Conditions might include a security remediation, a connector proof, a revised commercial proposal, or successful reconciliation of a disputed metric.
If you proceed, keep the first production scope narrow. Assign metric and data owners, publish a refresh and incident process, train by role, instrument usage, and schedule 30- and 60-day value reviews. Expansion should follow demonstrated adoption and outcome improvement—not the number of dashboards created.
If the evaluation sits inside a wider analytics program, use a 90-day BI strategy roadmap to connect the pilot with ownership, governance, adoption, and value measurement.
Red flags when comparing retail analytics software
Several warning signs are easy to miss in a scripted demo:
- The vendor cannot explain how a displayed metric was calculated.
- “Real time” has no stated latency, monitoring, or failure behavior.
- Product and store hierarchies are flattened with no history.
- AI answers do not expose assumptions, filters, or supporting records.
- Access control works in dashboards but not exports, alerts, or natural-language results.
- Forecast accuracy is presented without a baseline, backtest window, or segment detail.
- Every implementation task is described as easy but has no named owner.
- Pricing excludes required services, compute, connector, or usage charges.
- The proof of concept uses only vendor-created sample data.
- The platform solves reporting but not the chosen decision workflow.
One red flag does not always disqualify a vendor. It does identify a risk that should be resolved in writing before the decision.
Frequently asked questions
What are examples of retail analytics platforms?
Retail analytics platforms include retail suites with planning and merchandising workflows, business intelligence products, warehouse-native analytics tools, ecommerce or POS analytics, and specialist applications for pricing, demand, inventory, customer, footfall, or supply-chain analysis. The useful comparison is not the longest vendor list; it is which category matches your decision, data architecture, users, and operating model.
What features should a retail analytics platform have?
It should connect the required data, preserve retail grain and hierarchies, govern shared metrics, support inventory and omnichannel analysis, enable safe self-service, deliver dashboards and alerts, and provide appropriate forecasting, security, privacy, performance, and administration. The platform should also make data freshness, assumptions, and lineage visible.
What is the difference between retail analytics and POS reporting?
POS reporting primarily explains transactions captured by the point-of-sale system. Retail analytics can combine POS data with ecommerce, inventory, product, customer, marketing, workforce, supplier, and fulfillment data to answer questions that cross systems. If all important decisions live inside one POS, its built-in reporting may still be the simpler choice.
Which retail KPIs should the platform track?
Choose KPIs from the decision rather than copying a generic dashboard. Common measures include net sales, comparable-store sales, units per transaction, average order value, gross margin, sell-through, days of supply, stockout rate, inventory turn, markdown rate, return rate, promotion lift, conversion, retention, and on-time fulfillment. Every KPI needs a documented grain, time rule, owner, and action.
How do you evaluate AI in retail analytics software?
Test AI with representative data, ambiguous questions, missing fields, and known answers. Check interpretation, supporting evidence, reproducibility, access controls, audit history, model monitoring, and human approval. For forecasting, require backtests against a defined baseline and review error by the level at which decisions are made.
How long should a retail analytics pilot take?
The right duration depends on data access and the decision cycle, but scope matters more than a universal number. The pilot should be long enough to connect representative data, reconcile metrics, test security, let real users work unassisted, and observe at least one complete decision cycle. If it expands into a company-wide data cleanup, the scope is no longer a focused product evaluation.
Does a retailer need a data warehouse first?
Not always. A platform can use native application data, governed database views, replicated operational data, or an existing warehouse. A warehouse becomes more valuable when the retailer needs durable multi-system history, conformed identifiers, reusable metrics, high concurrency, workload isolation, or advanced modeling. Avoid building a new warehouse solely because a vendor demo assumes one.
Choose the platform that improves a real retail decision
The best retail analytics platform is the one your team can trust and use at the moment a decision must be made. Start with the decision, prove the data and metric foundation, test the whole user workflow, and score evidence from your own pilot.
If your priority is giving business users a safe way to explore existing database data without waiting for SQL or a new ETL project, evaluate that path directly with a representative question and access policy. If your priority is specialized planning, pricing, or merchandising execution, make those workflows the center of the comparison. Either way, leave the pilot with a measured operational result—not just a preferred interface.
Ask your data a question instead
Connect your database and ask in plain English. GetInsights writes the SQL, runs it read-only, and hands you the chart and dashboard.
Start for free