Artificial Intelligence and Data Analytics: A Practical Guide for Business Leaders Who Don't Write SQL
Every guide on this topic explains what AI analytics is. None of them tell a founder what to do on Monday morning — which question to start with, what to ask a vendor, or how to run the numbers.

It's 9 PM. You're looking at your revenue dashboard and something is off—revenue has dropped week over week and you need to know which product line is responsible before tomorrow's board call. The answer is sitting in your database right now. But getting to it means drafting a Slack message to your data team, waiting until morning, and spending tonight making calls based on instinct instead of evidence.
That is the default reality for most SMB founders and ops managers today. Artificial intelligence and data analytics have changed this equation fundamentally. Modern AI analytics tools translate plain-English questions into database queries instantly, without requiring SQL knowledge, new infrastructure, or a data analyst on call. This guide walks through how that works, how to implement it, and how to evaluate whether it's right for your team.
How Is Data Analytics Related to AI? (The Plain-English Answer)
How is data analytics related to AI? Data analytics is the process of examining data to answer business questions. AI automates the hard parts of that process—writing queries, detecting patterns, and generating visualizations—so that non-technical users can get answers directly from their data without knowing how to extract it. Together, they turn a database from a locked filing cabinet into an always-available source of answers.
What traditional data analytics actually requires
Traditional analytics works like searching a filing cabinet by hand. To find something specific, someone has to know exactly where to look, how the files are organized, and which drawer contains which records.
In practice, that means writing SQL—a programming language designed specifically to extract and manipulate data from databases. Most business leaders do not write SQL, which means every data question becomes a request that sits in someone else's queue.
What AI adds to the analytics process
AI acts as the search function across that filing cabinet. Instead of needing to know the folder structure, you type what you're looking for in plain English and the system finds it.
Specifically, AI translates natural-language questions into SQL queries automatically, identifies patterns in large datasets that would take a human analyst hours to surface, and generates charts without requiring any configuration. The analytical work still happens—AI just does it in seconds instead of hours.
Why that combination matters for non-technical leaders
The combination means the people closest to business decisions can get answers without depending on someone who knows the technical infrastructure. A founder checking MRR by customer cohort, a PM asking which feature drives retention, an ops manager comparing fulfillment costs across regions—none of those questions require a data team when AI handles the translation layer.
Speed matters here too. A question answered in two minutes at 9 PM is categorically different from the same answer delivered the next morning.
What AI Actually Does Inside a Modern Analytics Workflow
Understanding the specific tasks AI performs helps you evaluate whether a tool actually solves your problem. These are not abstract capabilities—they are concrete functions that replace manual steps in your current workflow.
Natural language to SQL: turning questions into queries automatically
When you type "which customer segment had the highest churn last quarter," the AI reads that sentence, figures out which tables in your database contain relevant data, writes a SQL query to retrieve it, and returns the result.
This is the core AI function that matters most to non-technical users. It removes the translation step that previously required an analyst. You ask; it finds the answer in your database and hands it back in seconds.
Automated chart and dashboard generation
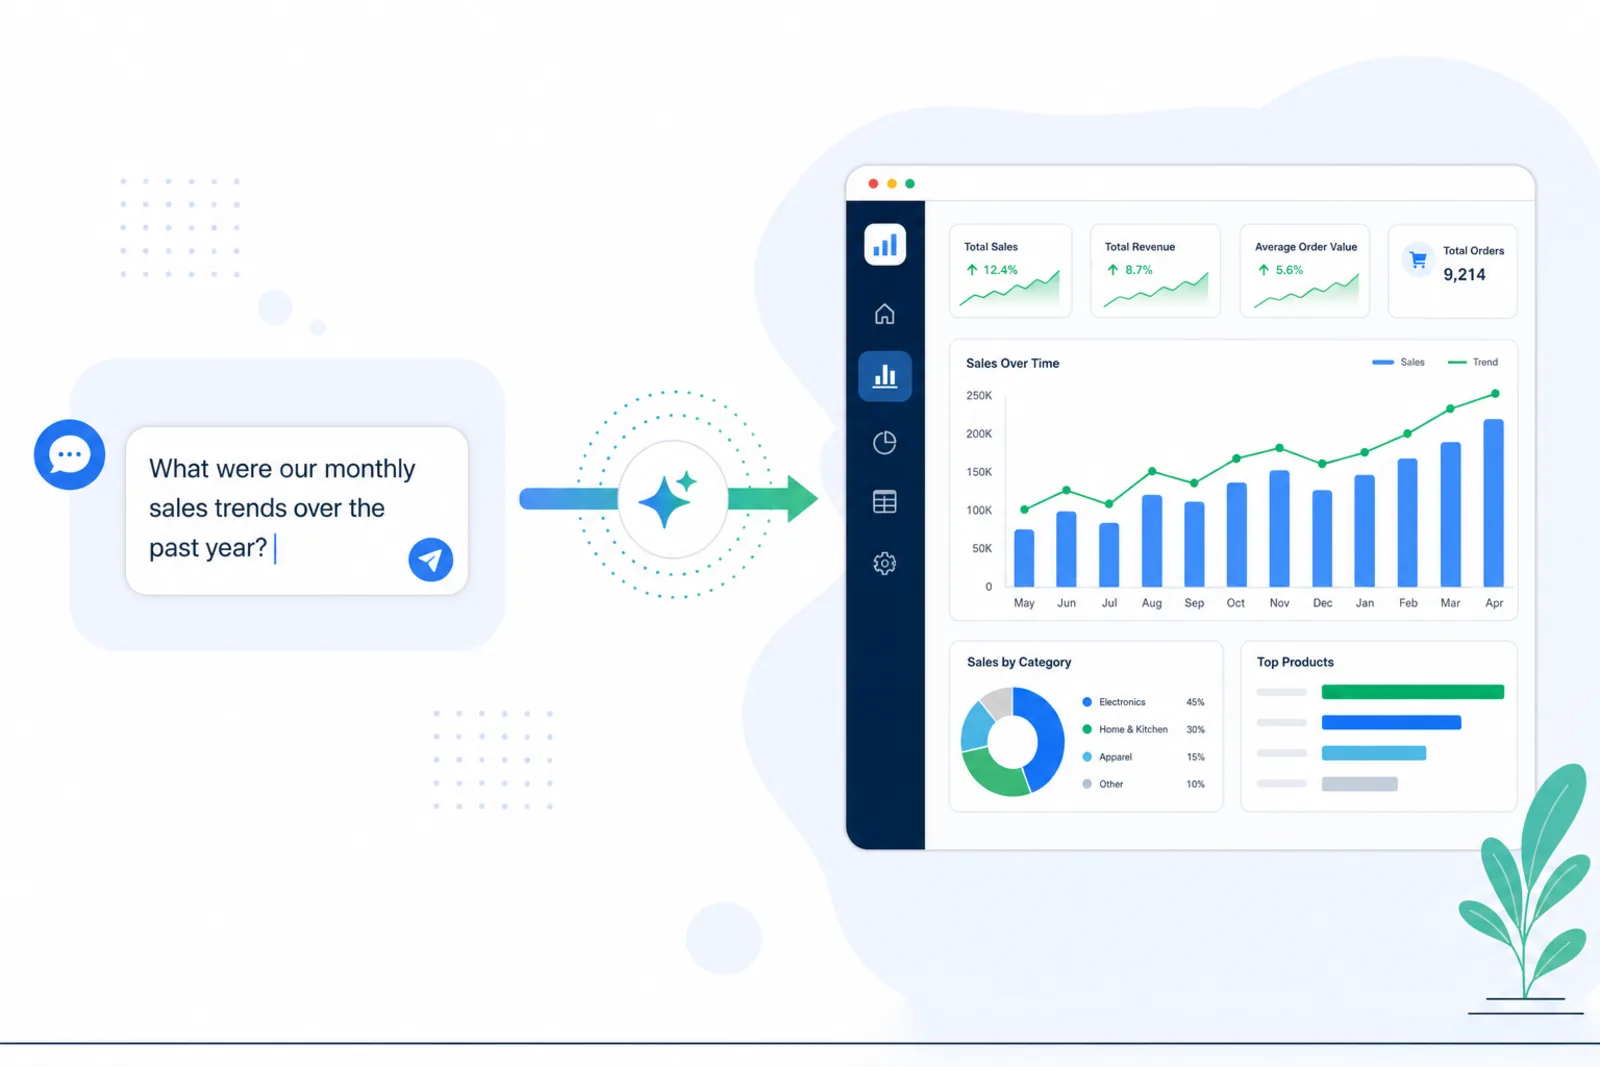
Once the data is retrieved, AI tools automatically select the most appropriate chart type and render it without manual configuration. A question about revenue over time produces a line chart. A question comparing categories produces a bar chart.
This removes a second manual step—the one where a data analyst copies query results into a spreadsheet, formats a chart, and sends it back. The visualization appears with the answer.
Pattern detection and anomaly alerts without manual digging
AI continuously monitors your data and surfaces changes that would otherwise require manual investigation. If customer acquisition cost spikes unexpectedly on a Tuesday, an AI analytics tool can flag that without anyone having to think to look.
This shifts analytics from reactive—checking dashboards when something feels wrong—to proactive, where the system tells you when something needs attention.
How agentic analytics takes this one step further
Agentic analytics refers to AI systems that don't just answer individual questions but chain multiple analytical steps together autonomously. Instead of answering one query at a time, an agent can receive a goal, determine what data it needs, retrieve it, analyze it, and return a synthesized conclusion.
Heading into 2026, agentic patterns have moved from side experiments to the core of analytics strategies, with this approach becoming standard rather than experimental. (Source: Monte Carlo) For business leaders evaluating tools today, this means the category is mature—you are not betting on early-stage technology.
A Practical Guide to Building Your First AI Analytics Workflow Without Writing Code
Think of this as a practical guide to building agents for non-technical teams—a no-code path from data question to live answer, structured so you can complete the first version in an afternoon.
Step 1: Identify the one business question your team asks every week
Before touching any tool, write down the single question your team asks most often and cannot currently answer without requesting help. Not a list of twenty questions—one.
This matters more than it sounds. The recommended approach is to pick one workflow area and pilot a single AI-driven improvement, because small focused experiments build confidence before larger initiatives. (Source: Databricks) Starting with one question means you get a working result fast, which builds trust in the tool before you expand.
Good candidates: "What was our revenue by product last week?" "Which customers haven't placed an order in 60 days?" "Where did we lose users in the onboarding funnel this month?"
Step 2: Confirm your data is in a queryable database (what that means and how to check)
A queryable database is any structured database your business runs on—Postgres, MySQL, Snowflake, BigQuery, and similar systems all qualify. If your business uses a CRM, an e-commerce platform, a billing system, or a custom-built product, there is almost certainly a database behind it.
Check with whoever manages your technical infrastructure. Ask: "Is our data in a relational database, and can we connect a read-only tool to it?" A yes answer means you're ready. A no means your data may still be in spreadsheets or siloed platforms—a different problem to solve first.
Step 3: Connect an AI analytics tool to your existing database
This is where most non-technical leaders expect friction, and where modern tooling has made the biggest improvement. Tools like GetInsights connect directly to your existing database—Postgres, MySQL, Snowflake, and others—and enforce a read-only layer so nothing gets changed or deleted. Setup takes minutes, not sprints.
The key requirement at this step is read-only access. Any AI analytics tool you connect to a production database should be incapable of writing to that database. Confirm this before connecting anything.
Step 4: Run your first plain-English query and validate the answer
Type your one question exactly as you would ask a colleague. Don't try to phrase it like a database query—that defeats the purpose. "What were our top five products by revenue in March?" is exactly the right format.
When the answer comes back, validate it against something you already know. If you already know March revenue landed near a certain figure and the tool returns a sum within a percent or two of it, that's a reasonable match. If it returns a number an order of magnitude off, something is wrong with the connection or the data mapping—stop and investigate before building anything on top of it.
Step 5: Save, share, and schedule the output as a living dashboard
Once you've validated the answer to your first question, save it as a persistent view. Most AI analytics tools allow you to pin queries as dashboard panels, share them with colleagues via a link, and schedule automated refreshes so the answer stays current without anyone re-running the question.
This converts a one-time query into an operational tool. Next week's answer appears automatically.
Real Use Cases: How Founders, PMs, and Ops Managers Use Artificial Intelligence and Data Analytics
Think of AI analytics as an AI/BI genie—an on-demand analytical expert embedded in your tools, always available, never backlogged, and capable of answering any well-formed question against your live data. Here is what that looks like across three roles.
Founders: daily revenue and churn visibility without analyst dependency
The question founders ask most: "What's our MRR by cohort, and which segments are churning fastest?"
The old process: File a ticket with the data team. Wait 24 to 48 hours. Receive a spreadsheet. Discover the numbers need clarification. Repeat.
The AI process: Type "Show me MRR by customer cohort for the last six months and flag any cohorts with churn above 5%." Read the chart. Decide.
Consider a SaaS founder tracking 800 active subscribers across three pricing tiers. Previously, cohort churn analysis was a quarterly exercise because it took an analyst half a day to produce. With AI analytics connected to the billing database, it's a two-minute check run whenever needed—before a board call, after a pricing change, or at 9 PM when something looks off.
Product managers: feature adoption and user behavior answered in minutes
The question PMs ask most: "Which feature is most correlated with users who are still active at Day 30?"
The old process: Request a custom event analysis from the data team. Wait for the query to be scoped, written, and reviewed. Receive results that may already be outdated.
The AI process: Type "Which features did users who are still active after 30 days use in their first week?" Receive a ranked breakdown by feature. Take it into the next sprint planning session.
A PM on a mid-market SaaS product can use this to run weekly retention experiments without engineering or analytics involvement—testing hypotheses about feature stickiness and adjusting onboarding flows based on live data rather than quarterly reports.
Operations managers: supply, fulfillment, and cost variance tracked automatically
The question ops managers ask most: "Why is our fulfillment cost per unit higher in one region than another?"
The old process: Pull fulfillment reports manually, align them with cost data in a separate spreadsheet, and spend an afternoon reconciling the numbers before a meaningful comparison is possible.
The AI process: Type "Compare average fulfillment cost per unit by warehouse region for the last 90 days." The breakdown appears in seconds, with the variance visible immediately.
An ops manager overseeing three regional fulfillment centers can set this as an automated weekly report, surfacing cost anomalies before they compound into budget problems.
How to Evaluate AI Analytics Tools: What Actually Matters for SMBs
Use this section as a checklist when you sit through any vendor demo. These five criteria separate tools that actually work for non-technical SMB teams from those built for enterprise data engineering teams.
Does it connect to your existing database without ETL?
ETL (Extract, Transform, Load) is a data engineering process that moves and reformats data before a tool can read it. If a vendor requires ETL before you can ask your first question, that means weeks of setup work and ongoing maintenance before you see any value.
The right answer from a vendor: direct connection to your existing database, no transformation layer required. If they can't do this, move on.
Is there a read-only safety layer to protect your production data?
Any AI tool connected to a live production database must be enforceably read-only. "We trust the AI not to write anything" is not the same as "it is technically incapable of writing anything."
Ask vendors directly: "Is the read-only constraint enforced at the connection level, or is it a configuration setting?" Enforced at the connection level is the only acceptable answer for a production database.
How does it handle data quality and bias in your existing datasets?
This is the criterion most buyers skip, and it matters most. AI models rely on existing datasets that may contain biases, gaps, or inconsistencies. When a dataset reflects outdated trends or lacks diversity, the AI reinforces those patterns instead of surfacing new ones—producing insights that are statistically sound but do not reflect business reality. (Source: Sigma Computing)
Before evaluating a tool, identify which of your tables are regularly updated and which contain stale or incomplete data. Then ask the vendor: how does the tool signal when it's querying low-confidence or sparse data? A good tool will surface uncertainty rather than mask it.
What does pricing look like for a team of 5 to 50 people?
Most enterprise analytics platforms are priced for large organizations with dedicated data teams, and the quote reflects that. For a team of 5 to 50, look for published per-month tiers that include multiple user seats and direct database connections without a custom contract.
Be cautious of platforms that charge per query or per data row—those pricing structures become expensive quickly as usage grows. Flat monthly pricing with seat-based scaling is the most predictable model for SMB budgets.
How quickly can a non-technical user get their first answer?
Ask every vendor this directly: "If I connect my database today, how long until I can run my first natural-language query?" The answer should be measured in minutes or hours, not days or weeks.
Request a live demo using your own data or a close approximation. If the sales process requires multiple discovery calls before a demo is possible, that is a signal about the complexity of the setup.
Common Pitfalls When Implementing AI Analytics (and How to Avoid Them)
These mistakes are common and understandable. Knowing them before you start is the only advantage that matters.
Pitfall 1: Starting with too many questions at once
What it looks like: You connect the tool, immediately start building a 12-panel dashboard covering revenue, churn, inventory, support tickets, and CAC, and two weeks later nothing is validated and nobody is using it.
How to prevent it: Commit to answering exactly one question before adding a second. Get the first answer, validate it, share it with your team, and confirm it changes a decision. Then expand.
Pitfall 2: Trusting AI output without checking it against a known result
What it looks like: The tool returns a monthly revenue figure and it looks plausible, so you include it in a board presentation. Later, someone notices the number excluded a product category because of a naming inconsistency in the database.
How to prevent it: For every new query you build, cross-reference the result against one number you already know to be true—a bank statement total, a manually-counted metric, or a figure from a report you've verified before. Do this once per query before trusting the output at scale.
Pitfall 3: Picking a tool that requires your IT team to deploy
What it looks like: You choose an analytics platform based on its feature list, then discover that connecting it to your database requires your engineering team to configure infrastructure, manage credentials, and maintain an integration layer. The project stalls for three months.
How to prevent it: Before signing any contract, ask whether a non-technical user can complete the database connection without engineering involvement. If the answer involves the word "deployment," keep looking.
Pitfall 4: Skipping the data quality audit before going live
What it looks like: You connect the tool, run queries, and get answers that feel wrong—because they are. Turns out, the orders table hasn't been cleaned in 18 months and includes cancelled orders that were never removed.
How to prevent it: Before connecting any AI analytics tool, spend one hour with whoever manages your database to identify which tables are actively maintained and which contain historical or unreliable data. Start your queries only against the clean tables.
The Real Cost Benefit of Artificial Intelligence and Data Analytics at SMB Scale
The business case for AI analytics at SMB scale comes down to one comparison: what it costs to answer data questions the way you do now, versus what it costs to answer them with AI. Most vendors will hand you their own ROI calculator. Build your own instead — it takes about fifteen minutes and the inputs are all numbers you already have.
The three numbers that decide the case
Skip industry averages. Your own figures are the only ones that matter here, and none of them require a spreadsheet model.
Number one: questions per week. Count the data requests your team made over the last two weeks — Slack messages, tickets, "can you pull me a quick number" asks. Divide by two.
Number two: turnaround time. For each of those requests, how long between asking and getting a usable answer? Not the time the analyst spent querying — the wall-clock time the requester waited.
Number three: decisions affected. Of those requests, how many were tied to a decision that got made before the answer arrived? This is the number that actually justifies the spend, and it is the one nobody tracks.
Why the analyst-versus-tool comparison is the wrong frame
The instinct is to compare a subscription against an analyst salary. That comparison is misleading, because analysts do work AI tools cannot: designing metrics, auditing data quality, investigating anomalies that require domain context, and pushing back when a question is framed badly.
The better frame is capacity. An AI analytics tool absorbs the routine query volume — the recurring pulls, the "what was X last month" questions, the dashboard refreshes — so the analyst you already employ spends their time on work that needs judgment. If you have no analyst, the tool converts questions that previously went unanswered into questions that get answered.
A cost framework you can fill in yourself
Use the structure below with your own numbers. Compare a full quarter, not a month — setup effort is front-loaded and distorts a single month's view.
| Cost Category | How to Calculate It |
|---|---|
| Waiting cost | Questions/week × avg wait in working hours × loaded hourly cost of the requester |
| Analyst opportunity cost | Share of analyst time on routine pulls × their loaded quarterly cost |
| Tool cost | Published subscription price for your seat count × 3 months |
| Setup cost | Hours to connect the database and validate the first queries × loaded hourly cost |
| Decision cost | Count of decisions made without data, from number three above |
Waiting cost and analyst opportunity cost are the two that usually dominate, and both are recoverable. Decision cost is the hardest to quantify and typically the largest — a single pricing or inventory call made on instinct can outweigh a year of subscription fees in either direction.
If the recoverable side of that table does not clear the tool cost for your team, the honest answer is that AI analytics is not yet the constraint worth solving. That is a legitimate outcome of running the numbers.
FAQ
How is data analytics related to AI?
Data analytics is the process of examining data to surface business insights. AI automates the hardest parts—writing queries, detecting patterns, and building visualizations—so non-technical users can get answers directly without knowing SQL or data engineering. See the dedicated section above for a full breakdown of how each component works.
Will data analytics be replaced by AI?
Not entirely. AI replaces the repetitive, technical parts of analytics—writing queries, formatting charts, running scheduled reports. But the judgment layer remains human: deciding which questions matter, interpreting results in business context, and determining what action to take. Analysts who focus on strategic interpretation will remain valuable; analysts whose primary job is writing routine SQL queries will need to evolve their role.
What is the difference between AI analytics and traditional business intelligence?
Traditional BI tools require pre-built dashboards and pre-written queries. You can only see what someone already decided to measure. AI analytics allows you to ask any question in plain English against live data and receive an answer immediately—without anyone having configured that specific report in advance. The shift is from static views of known metrics to dynamic exploration of any question against current data.
Do you need to know SQL to use AI data analytics tools?
No—that is the entire point. Modern AI analytics tools translate plain-English questions into SQL automatically. You type your question the way you'd ask a colleague; the AI writes and executes the query behind the scenes and returns the result. No SQL knowledge is required at any step.
Conclusion
Where are you right now? If you're still living with the ticket queue—every data question routed through Slack and answered the next day—your next action is simple: write down the one question your team asks most often and use it as your evaluation benchmark for any tool you consider. If you're already evaluating tools, take the criteria from the evaluation section above into your next demo and ask each vendor the five questions directly. If you're ready to run your first query, start with one table, one question, and one validation check before building anything further.
The gap between having data and getting answers from it is now a tooling choice, not a skills gap. The technical barrier that kept business leaders out of their own data has been removed—what remains is choosing to use the tools that reflect that.
Keep reading to go deeper:
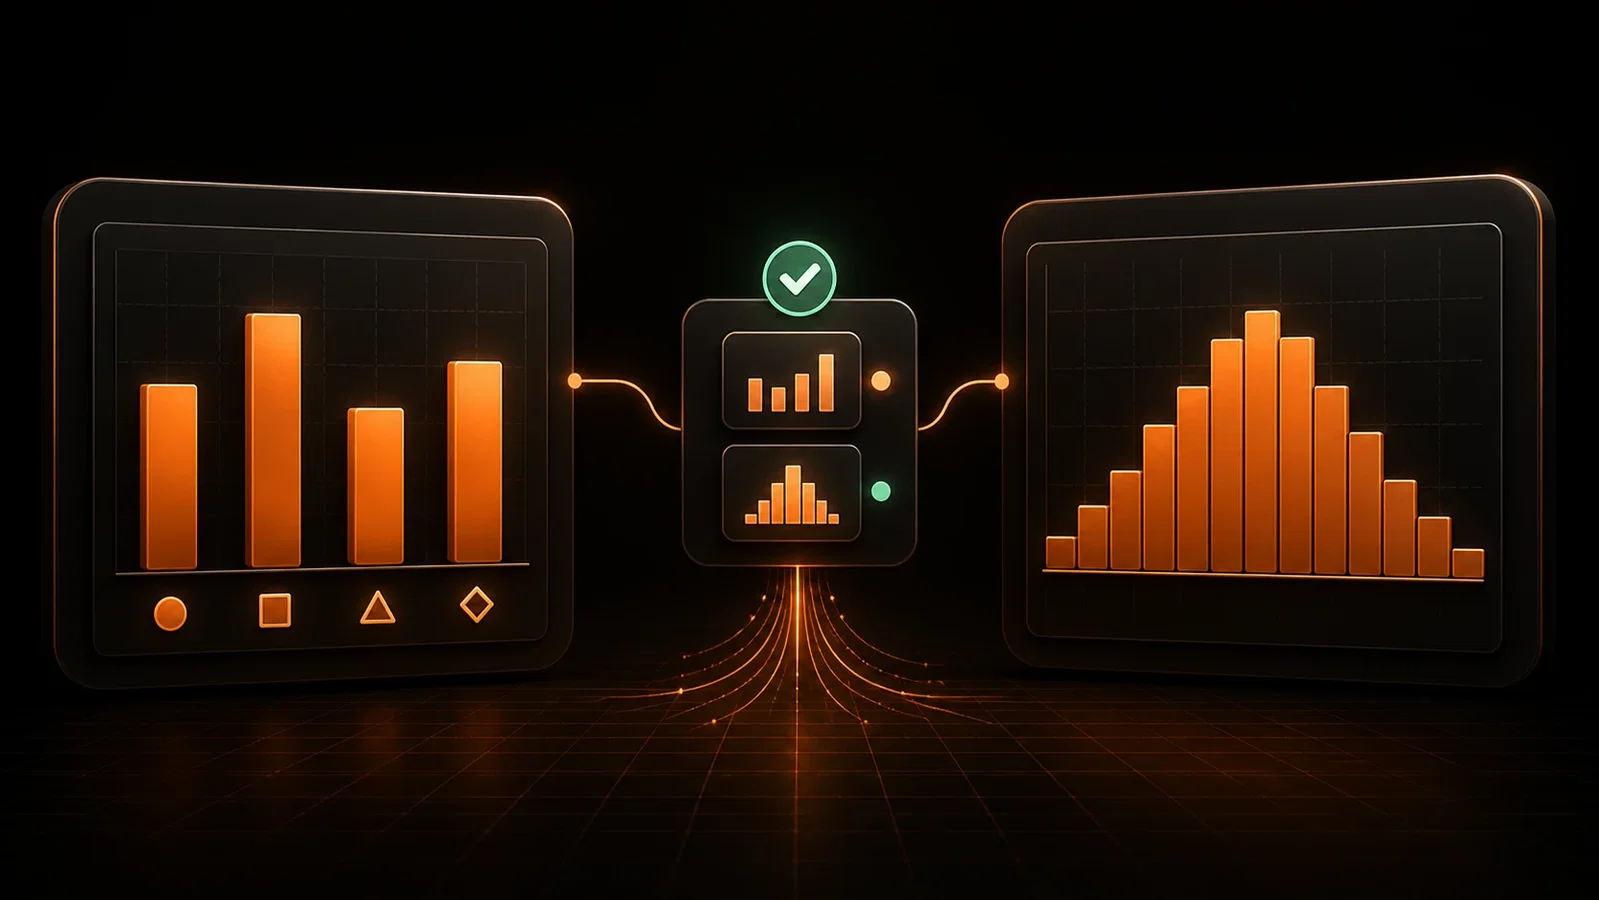
- Bar Graph vs Histogram: When to Use Each — choosing the right chart once you have the answer
Start with the one question your team asks most
GetInsights connects straight to your existing database and answers it in plain English — read-only, no ETL, no infrastructure changes.
Start for free